
When your dashboard turns red, can you trust what it’s telling you?
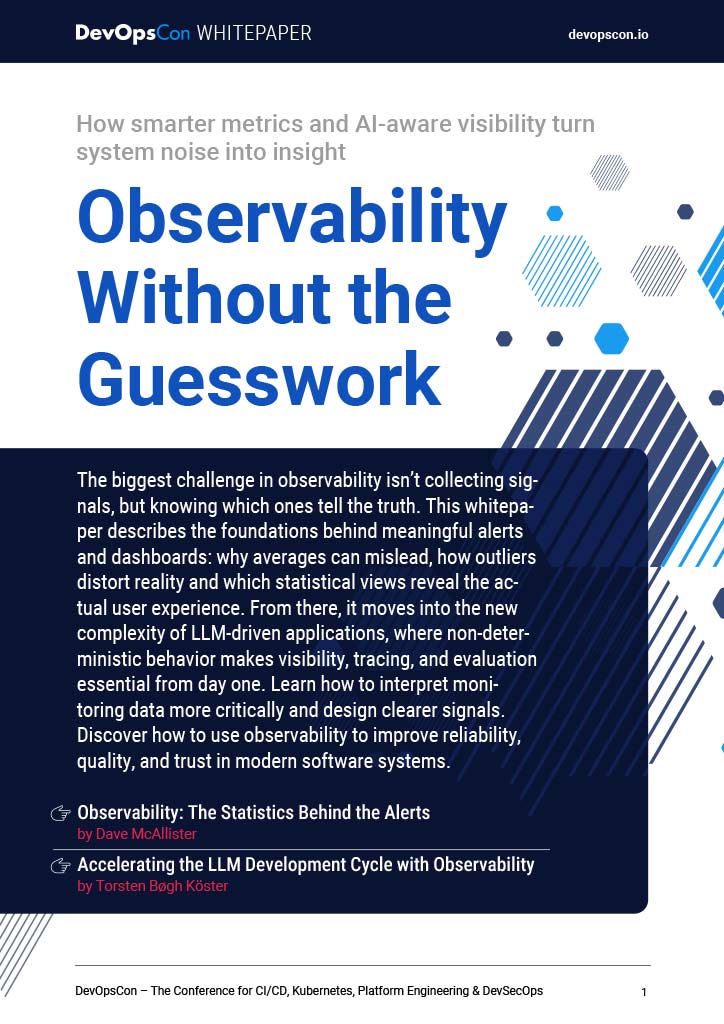
In this free whitepaper, you’ll learn:
-
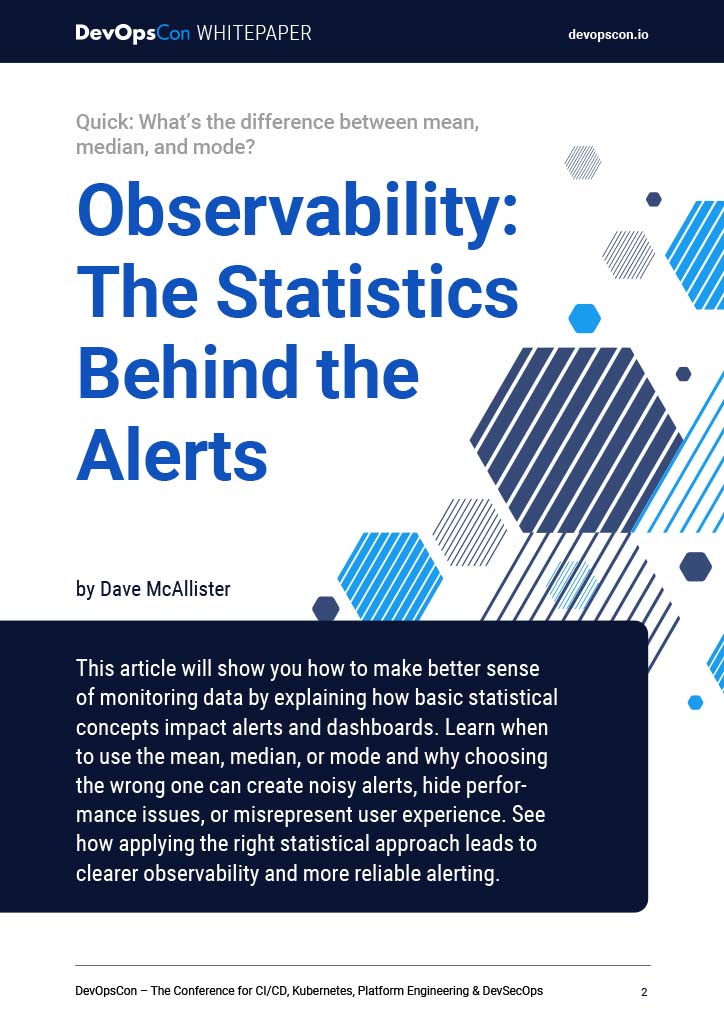
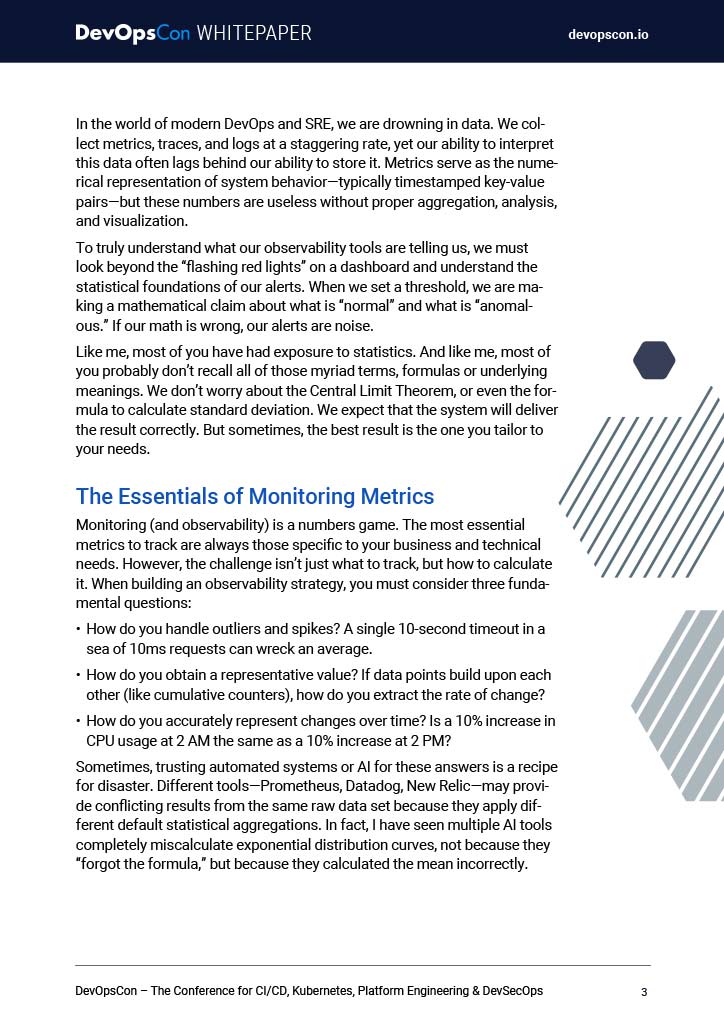
- Why the “average” on your dashboard is often a phantom number that represents none of your users, and which statistical view actually reflects their experience
- How to bring observability to non-deterministic LLM applications with OpenTelemetry, and why tracing and evaluation have to start on day one, not after launch
- How to build an “LLM as a Judge” evaluation loop with synthetic data, Promptfoo, and red teaming, while keeping PII out of your traces
Podcast Overview :
Table of Contents
-
-
-
- Why the biggest observability challenge is knowing which signals tell the truth
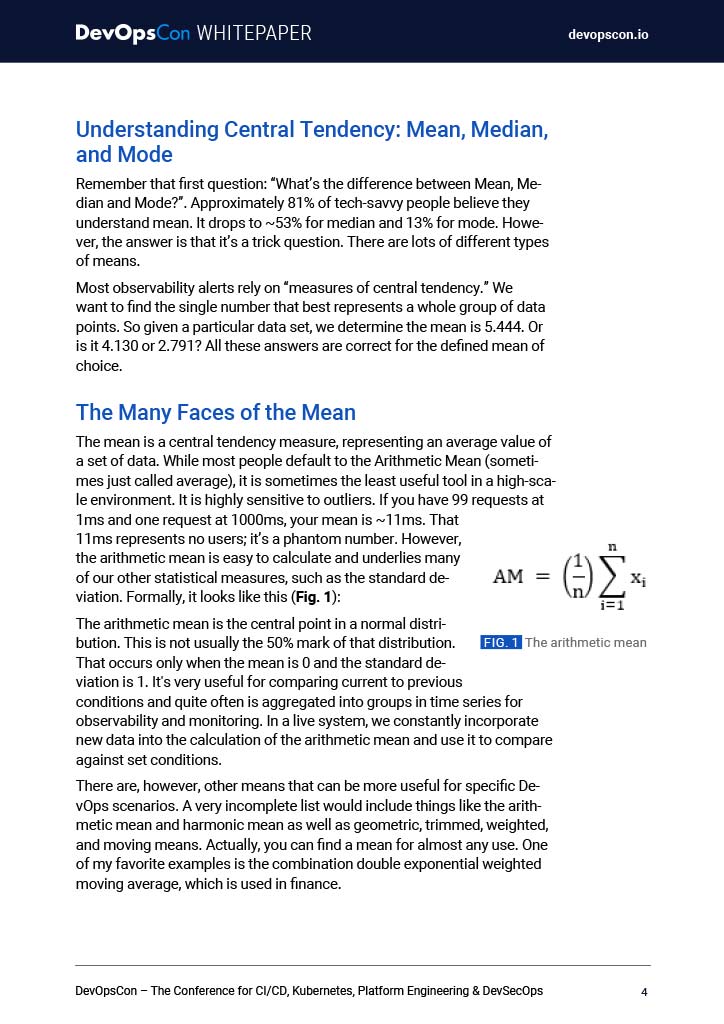
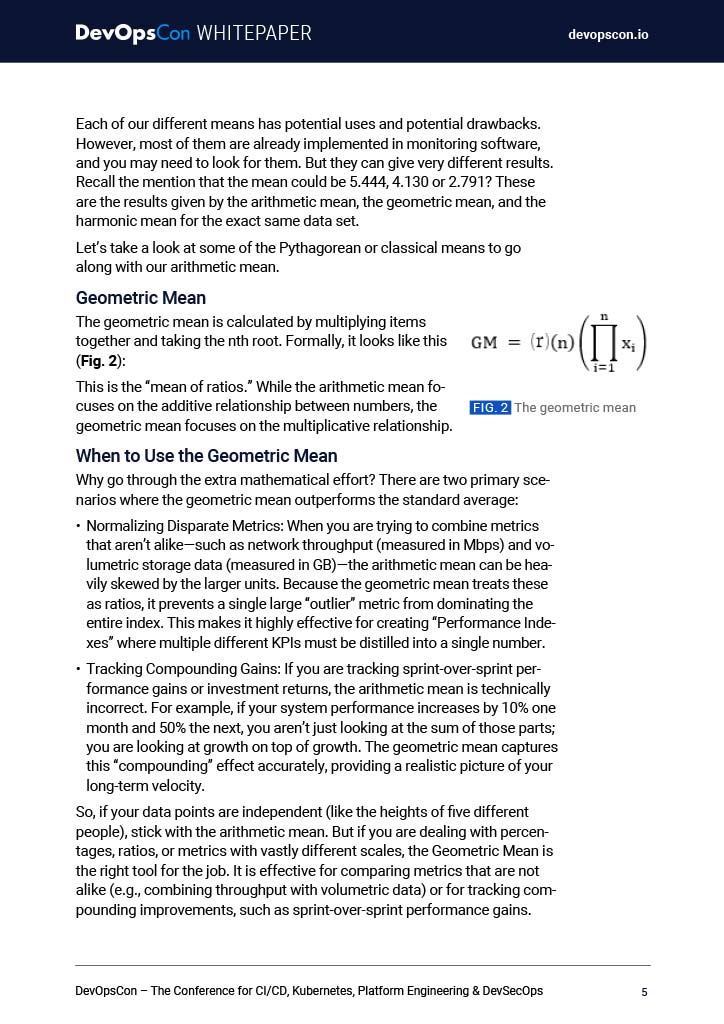
- The many faces of the mean: arithmetic, geometric, and harmonic
- When to use each mean, and why the wrong one creates noisy alerts
- The median: a resilient baseline that ignores the long tail
- The mode: spotting configuration drift and the “most likely” outcome
- Why non-deterministic LLMs make observability essential from day one
- Tracing with OpenTelemetry: spans, attributes, and GenAI metadata
- Choosing an LLM-focused OTEL receiver with Langfuse and Arize Phoenix
- LLM as a Judge: structured evaluation with synthetic data and Promptfoo
- Red teaming and taming PII in your LLM traces
-
-

by devm.io
by devm.io