Over the summer of 2019, I was watching my kids play. Indoors or out, with or without props, they were (and still are) always inventing some kind of game. At the time, they were re-enacting Pokemon battles, complete with sound effects, special moves, and crazy voices. I started thinking about how to preserve this creative spirit before the teenage years crept in. Dungeons and Dragons.
I played D&D twice myself: once when I was 11 with the boy next door, which was essentially a pointless character creation exercise, and once as a grown-up, when I just about died of awkwardness. But for my son and his friends, I could do this; I offered to be a Dungeon Master (DM) for them. I made a significant rookie mistake, however. I did not limit how many players my son could bring to the table. I ended up starting my DM adventure with a party of six 10-year-old boys (and sometimes a 6-year-old girl). I underestimated both the work—and the chaos—by several orders of magnitude.
You might be asking yourself “OK, but what on earth does this have to do with metrics?” The answer is: Timing.
Domain-specific application metrics are important. Measuring http throughput (which is the fixation of almost every description of application metrics out there) does not tell you enough about what your application is doing. I can get terrific throughput, for example, if a bug in my code causes it to skip entire code paths. A successful response code cannot tell you that your application is doing a subtly wrong thing. It’s too easy to write unit tests that don’t surface bugs. Therefore, I did that thing that developer advocates do: I submitted an abstract for a talk to prove my point about metrics. I then put off working on it (despite having it on my list of things to do) for the entire summer.
The beginning of September brought with it a mild panic: I had to ingest mountains of information about D&D to be able to lead my son and his friends through this game, and I had a completely new application and talk to prepare from scratch. In the interest of time, I put them together. What follows is the story of Monster Combat, an application that pits classic D&D monsters against each other using D&D 5E combat rules and application metrics to analyze what happens.
For SpringOne 2019, I created a Spring Boot application with a few application endpoints to drive combat encounters and used Micrometer and the Spring Boot actuator to define and surface application metrics using a Prometheus endpoint. I was using Game Master 5 (by Lion’s Den) to manage my campaign on my iPad which has a compendium that can be exported in XML format. My application retrieved 1063 monsters from that document. I created a game engine for combat that set up encounters of 2-5 monsters and pit them against each other in rounds until one monster remained. I measured the number and duration of rounds and encounters, along with some statistics about the effectiveness of attacks and the most and least lethal monsters. I survived the talk, but I wasn’t happy with the application in the end.
Time passed, and it was time to revisit the application for DevNexus 2020 because (as any good advocate does) I’d submitted the talk again. I intended to try a few different metrics libraries and compare their capabilities, which gave me an excuse to do one of my favorite things: refactor my code! I decided to fetch monster definitions from less verbose and more consistent wiki pages and store the digested result in a JSON file. I moved the game engine to a core library and restructured it to work with this cleaner data source. I was much happier with the end result, despite having fewer monsters (215) to work with.
A brief overview of D&D
D&D is a role-playing game. The DM creates the setting and context, with problems to solve, challenges to overcome, and creatures with which to interact. Players then tell their half of the story, describing how their characters behave in that setting. Dice rolls are the key mechanic that maintains balance between the two sides of this joint narrative, from generating monster statistics to deciding if the sneaky rogue makes an epic discovery or stubs their toe and falls down the stairs.
I worried about combat. Keeping the attention of six kids was going to be hard enough; stopping the action to go check rules was unlikely to help. While the structure of a combat encounter is pretty straight-forward, sorting out the specific behavior of different kinds of attacks was a lot to decipher. This is going to get really nerdy, but I hope it will help those that haven’t ever played D&D follow my (mis-)adventures with metrics. We’ll start with the characteristics and abilities of monsters and work our way up to combat and attack rules.
Every monster in the bestiary has a type, a size, an armor class (AC), and hit points (HP). Both type and size are lists of bounded size, essentially enumerations. Armor class is a simple integer value that expreses how hard it is to hit (successfully attack) a creature. Creatures with a low AC are much easier to hit than creatures with a high AC. Hit points represent how much damage a creature can take. Some examples:
- A Pseudodragon is a tiny dragon with an armor class of 13. It has 7(2d4+2) hit points, which means the DM can either use the average value (7) or roll two 4-sided dice and add 2 to the result.
- A Deva is a medium celestial with an AC of 17 and 136(16d8+64) HP.
- A Terrasque, the epic monster of D&D 5e, is a gargantuan monstrosity with an AC of 25 and 676(33d20+330) HP.
Every monster has six core ability scores: strength, dexterity, constitution, intelligence, wisdom, and charisma. It may also be proficient in certain skills. Collectively, skills and proficiencies are the basis of modifiers that make it easier (or sometimes harder) for a creature to perform a certain kind of attack.
Most of the time, monsters have or carry weapons that they use to inflict different types of damage on their opponents. A roll of the dice, specifically the iconic 20-sided die used for most tests and checks in D&D, is augmented with modifiers, and the result is compared to the opponent’s AC. If the attack value matches or exceeds the AC, the attack succeeds. There are two “critical” caveats, however: if a 1 is rolled, the attack automatically fails (a critical miss or critical fail); if a 20 is rolled, the attack automatically succeeds (a critical hit). A critical hit succeeds so well that the attacker gets to double the weapon damage for their attack.
There’s also another kind of attack, such as a spell is cast, or a creature breathes fire. This attack type just happens and it is then up to the target to make a saving throw: to roll a d20 (with modifiers) to evade or save itself from damage. The result is compared to a difficulty class (DC) instead of an armor class. In some cases, an arbitrary DC is specified for attack; in others, the DC is based on the skill or ability of the attacker.
The Ancient Green Dragon, as an example, can rain damage on opponents in different ways. It can:
- use its claws — a d20 roll + 15 (a modifier based on dragon abilities and proficiencies) to hit one target within 10 feet. If it hits, the target takes either an average of 22 or a roll of 4d6 + 8 points of slashing damage: 22(4d6+8).
- use its bite — a d20 roll + 15 to hit one target within 15 feet. If it hits, the target takes 19(2d10+8) piercing damage plus 10(3d6) poison damage.
- use its tail — a d20 roll + 15 to hit one target within 20 feet. If it hits, the target takes 17(2d8+8) bludgeoning damage.
- use its poison-breath — a special dragon ability. The text for this follows a pattern seen for most attacks requiring a saving throw: “The dragon exhales poisonous gas in a 90-foot cone. Each creature in that area must make a DC 22 Constitution saving throw, taking 77(22d6) poison damage on a failed save, or half as much damage on a successful one.”
An Ancient Green Dragon is a frightening beast; it also capable of two claw attacks and one bite attack in a single turn. Adventuring parties are crazy. I’m just saying.
A combat encounter has a simple general structure:
- There might be a surprise round if attackers are hidden or stealthy.
- Participants are placed in an initiative order, from who goes first to who goes last, by rolling a d20.
- Begin a round of combat, with each creature taking a turn in initiative order.
- Repeat the previous step until combat ends.
At the table, combat can end for any number of reasons. As mentioned earlier, my application follows the Highlander model: combat ends when only one creature remains.
Asking questions
When deciding what to measure and how to measure it, I received some top-notch advice from my husband, who has stronger feelings about both statistics and dashboards than I do. “Anyone can make meaningless data look pretty on a dashboard. Focus on the actions you’d like to inform.” In other words, don’t measure or create dashboards if you can’t take action based on the result.
On one hand, I was curious. I wanted to know how the different pieces of this system worked together. How many rounds (on average) are in an encounter? How often are attacks successful? What kinds of weapons do the most damage? What is the most (or least) lethal monster?
On the other, implementation choices could impact the outcome of encounters. Behavior of the dice, the creatures included in the encounter, target selection, average or variable damage. One of the tenets of application monitoring is understanding what is going on with your application by looking only at externalized measurements. What factors influence the length of an encounter? If I made a change to how targets are selected, would it make an observable difference?
Core mechanics: Rolling the dice
One of the first things I thought to measure was the behavior of the dice. Given how critical dice rolls are to the flow of the game, I felt it was important to observe distribution of rolls. To my husband’s point, if the dice rolls were very uneven, I could change the source of randomness or use some other algorithm to roll dice. When I refactored the game engine, I created a utility class to perform all dice rolls. A simple injection point allows the result of each roll to be recorded. With micrometer, for example, roll results are measured using a counter:
Dice.setMonitor((k, v) -> registry.counter(“dice.rolls”, “die”, k, “face”, label(v)).increment());
The label method converts the integer value of a roll (9) into a padded string (09) used as a value for the “face” label. Collected Prometheus data for dice rolls from that counter looks like this:
dice_rolls_total{die=”d10″,face=”08″,} 16750.0
dice_rolls_total{die=”d10″,face=”09″,} 16724.0
dice_rolls_total{die=”d10″,face=”06″,} 16804.0
The first Grafana dashboard created using that data is shown in Figure 1.
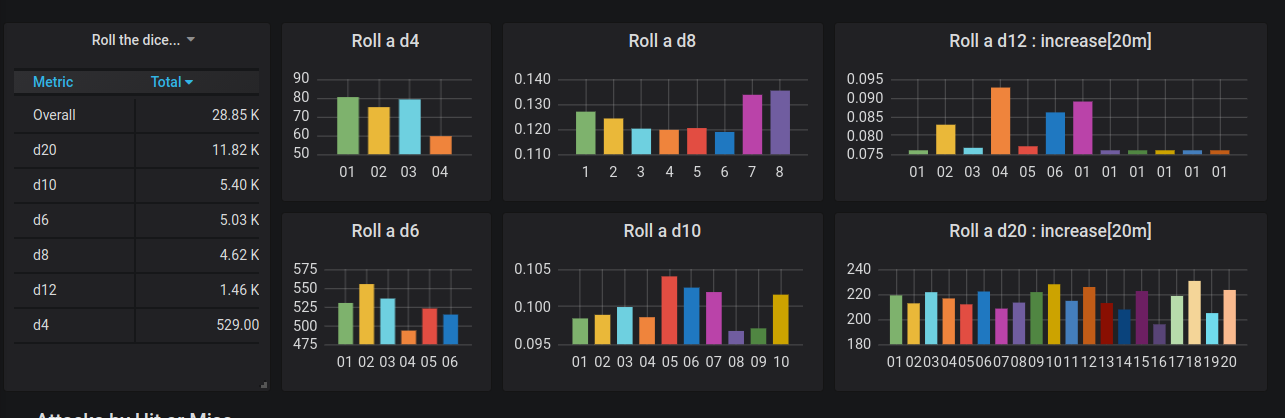
Figure 1. Graph of roll frequency, take 1
The graph for the d12 should grab your attention; it is different from all of the others. There was a bug. While I had written tests to make sure I could parse all flavors of dice roll formulas, I hadn’t written tests to verify that every die was used correctly. In a facepalm moment, I discovered a missing case in a switch statement. This was the first win for aggregated metrics. I would not have found this bug using log entries due to the sheer volume of data, and I obviously missed it with my tests. In fairness, pair programming would have caught this, but I was coding solo. From the perspective of the talk I was writing, I couldn’t have planned it better.
An updated version of that dashboard is shown in Figure 2. Note the differences in scale between the y-axis in these graphs. The d20, which is used to determine whether or not every attack hits, is used much more often than any of the others.
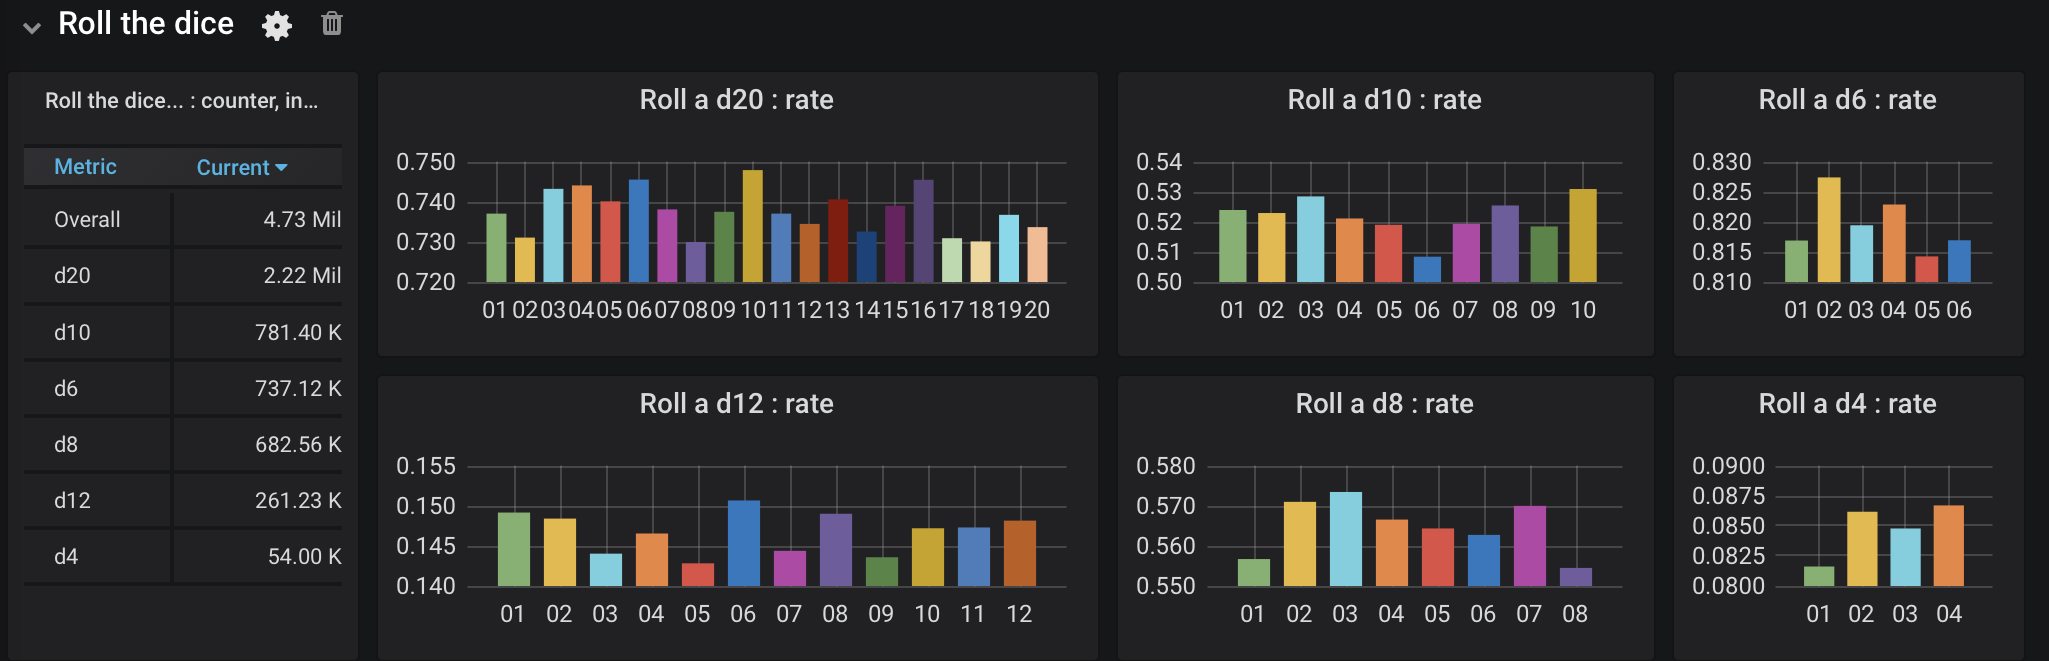
Figure 2. Graph of roll frequency, take 2
Combat encounters
Monster Combat has two applications, a Spring Boot application and a Quarkus application. Both use the core engine to create and drive encounters and rounds. The relevant code in either application looks like this:
Encounter encounter = beastiary.buildEncounter()
        .setHowMany(howMany)
        .setTargetSelector(pickOne(howMany))
        .build();

List results = new ArrayList<>();
while (!encounter.isFinal()) {
    RoundResult result = encounter.oneRound();
    metrics.endRound(result);
    results.add(result);
}
metrics.endEncounter(encounter, results.size());
To explain some elements in that snippet: the bestiary holds all creatures; howMany is a self- explanatory parameter; metrics is an object that allows an application to measure outcomes in whichever way it prefers. I inteded to use Micrometer, MP Metrics, and OpenTelemetry, but I didn’t quite get there due to limitations in some of those libraries. The list of round results is returned to the client in the HTTP response. Log entries for one round of an encounter look like this:
: : oneRound:
    Troll(LARGE GIANT){AC:15,HP:84(8d10+40),STR:18(+4),DEX:13(+1),CON:20(+5),INT:7(-2),WIS:9(-1),CHA:7(-2),CR:5,PP:12}(31/86.0)
    Pit Fiend(LARGE FIEND){AC:19,HP:300(24d10+168),STR:26(+8),DEX:14(+2),CON:24(+7),INT:22(+6),WIS:18(+4),CHA:24(+7),SAVE:[DEX(+8),CON(+13),WIS(+10)],CR:20,PP:14}(313/313.0)

: attack: miss: Troll(36) -> Pit Fiend(100)
: attack: miss: Troll(36) -> Pit Fiend(100)
: attack: hit> Troll(36) -> Pit Fiend(97) for 9 damage using Claws[7hit,11(2d6+4)|slashing]
: attack: hit> Pit Fiend(97) -> Troll(10) for 22 damage using Bite[14hit,22(4d6+8)|piercing]
: attack: MISS: Pit Fiend(97) -> Troll(10)
: attack: HIT> Pit Fiend(97) -> Troll(0) for 34 damage using Mace[14hit,15(2d6+8)|bludgeoning]

: oneRound: survivors
    Pit Fiend(LARGE FIEND){AC:19,HP:300(24d10+168),STR:26(+8),DEX:14(+2),CON:24(+7),INT:22(+6),WIS:18(+4),CHA:24(+7),SAVE:[DEX(+8),CON(+13),WIS(+10)],CR:20,PP:14}(304/313.0)
The output shows the ability scores for a Troll and a Pit Fiend, including their current hit points at the beginning of the round. The Troll has only 31 of its starting 86 hit points left (36% health), while the Pit Fiend has taken no damage thus far (100% health). The troll missed twice against the Pit Fiend’s 19 AC before landing a claw attack. The Pit Fiend made one successful bite attack against the Troll’s 15 AC, and then rolled a 1 for a critical miss followed by a 20 for a critical hit with its mace. The Troll was unable to survive the onslaught, and the Pit Fiend won the encounter.
Hits and Misses
As mentioned earlier, one of the things I wanted to understand was how often attacks were successful. Which is more common, hits or misses? The log snippet above happens to show each of the four outcomes we mentioned earlier:
HIT>— a critical hit (roll of 20)MISS:— a critical miss (roll of 1)hit>— a hit: either the attack value (roll + modifiers) was greater than or equal to the target’s AC, or it was a spell attack requiring a saving throw (which always hits).miss:— a miss: the attack value was less than the target’s AC.
To measure hits and misses, I used the following to convert three booleans (hit, critical, and saved) into a string value for a single hitOrMiss label:
String hitOrMiss() {
    return (isCritical() ? "critical " : "")
            + (isSaved() ? "saved " : "")
            + (isHit() ? "hit" : "miss");
}
I created a distribution summary that measured the difficulty of the attack: either the AC for a weapon-style attack, or the DC for an attack requiring a saving throw. I attached two labels to the measurement: the hitOrMiss label, and another to capture the attack type, either a weapon-style attack against the target’s armor class (attack-ac), or a spell-style attack requiring a saving throw (attack-dc).
registry.summary("attack.success",
                    "attackType", event.getAttackType(),
                    "hitOrMiss", event.hitOrMiss())
                    .record((double) event.getDifficultyClass());
The Prometheus data for this distribution summary looks like this:
# HELP attack_success
# TYPE attack_success summary
attack_success_count{attackType="attack-ac",hitOrMiss="miss",} 65.0
attack_success_sum{attackType="attack-ac",hitOrMiss="miss",} 1124.0
attack_success_count{attackType="attack-ac",hitOrMiss="critical hit",} 13.0
attack_success_sum{attackType="attack-ac",hitOrMiss="critical hit",} 229.0
attack_success_count{attackType="attack-ac",hitOrMiss="critical miss",} 10.0
attack_success_sum{attackType="attack-ac",hitOrMiss="critical miss",} 179.0
attack_success_count{attackType="attack-dc",hitOrMiss="hit",} 6.0
attack_success_sum{attackType="attack-dc",hitOrMiss="hit",} 92.0
attack_success_count{attackType="attack-dc",hitOrMiss="saved hit",} 9.0
attack_success_sum{attackType="attack-dc",hitOrMiss="saved hit",} 134.0
attack_success_count{attackType="attack-ac",hitOrMiss="hit",} 133.0
attack_success_sum{attackType="attack-ac",hitOrMiss="hit",} 2050.0
# HELP attack_success_max
# TYPE attack_success_max gauge
attack_success_max{attackType="attack-ac",hitOrMiss="miss",} 22.0
attack_success_max{attackType="attack-ac",hitOrMiss="critical hit",} 22.0
attack_success_max{attackType="attack-ac",hitOrMiss="critical miss",} 20.0
attack_success_max{attackType="attack-dc",hitOrMiss="hit",} 22.0
attack_success_max{attackType="attack-dc",hitOrMiss="saved hit",} 19.0
attack_success_max{attackType="attack-ac",hitOrMiss="hit",} 20.0
The first time I created a graph for this data, I found another problem looking only at the legend, which is shown in Figure 3. Can you spot it?
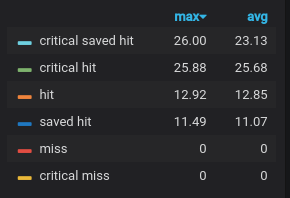
Figure 3. Attack success, take 1
You have to be a bit of a D&D nerd for this one, but a “critical saved hit” does not exist. I had another bug somewhere. Trying to find it was one of those 6-stages-of-debugging adventures. I definitely reached the “how did this ever work?” stage. After some code refactoring and repair, I made another attempt at visualizing attack success, shown in Figure 4.
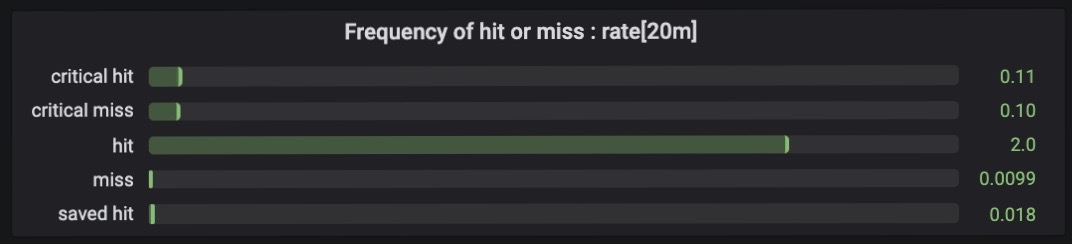
Figure 4. Attack success, take 2
Sadly, something was still wrong. Given how dice rolls should work, a miss should be more common than either a critical hit or a critical miss. It took some time to determine what was wrong, as the bug was not in the application code. I’d made a mistake in – the initial conversion from HTML to JSON. Regular expressions are awesome, but also sometimes dangerous. I’d missed a + when parsing the armor class, which meant that the highest AC value was a 9! Woops. Another win for aggregated metrics!
After correcting the error, I was able to create the dashboard shown in Figure 5.
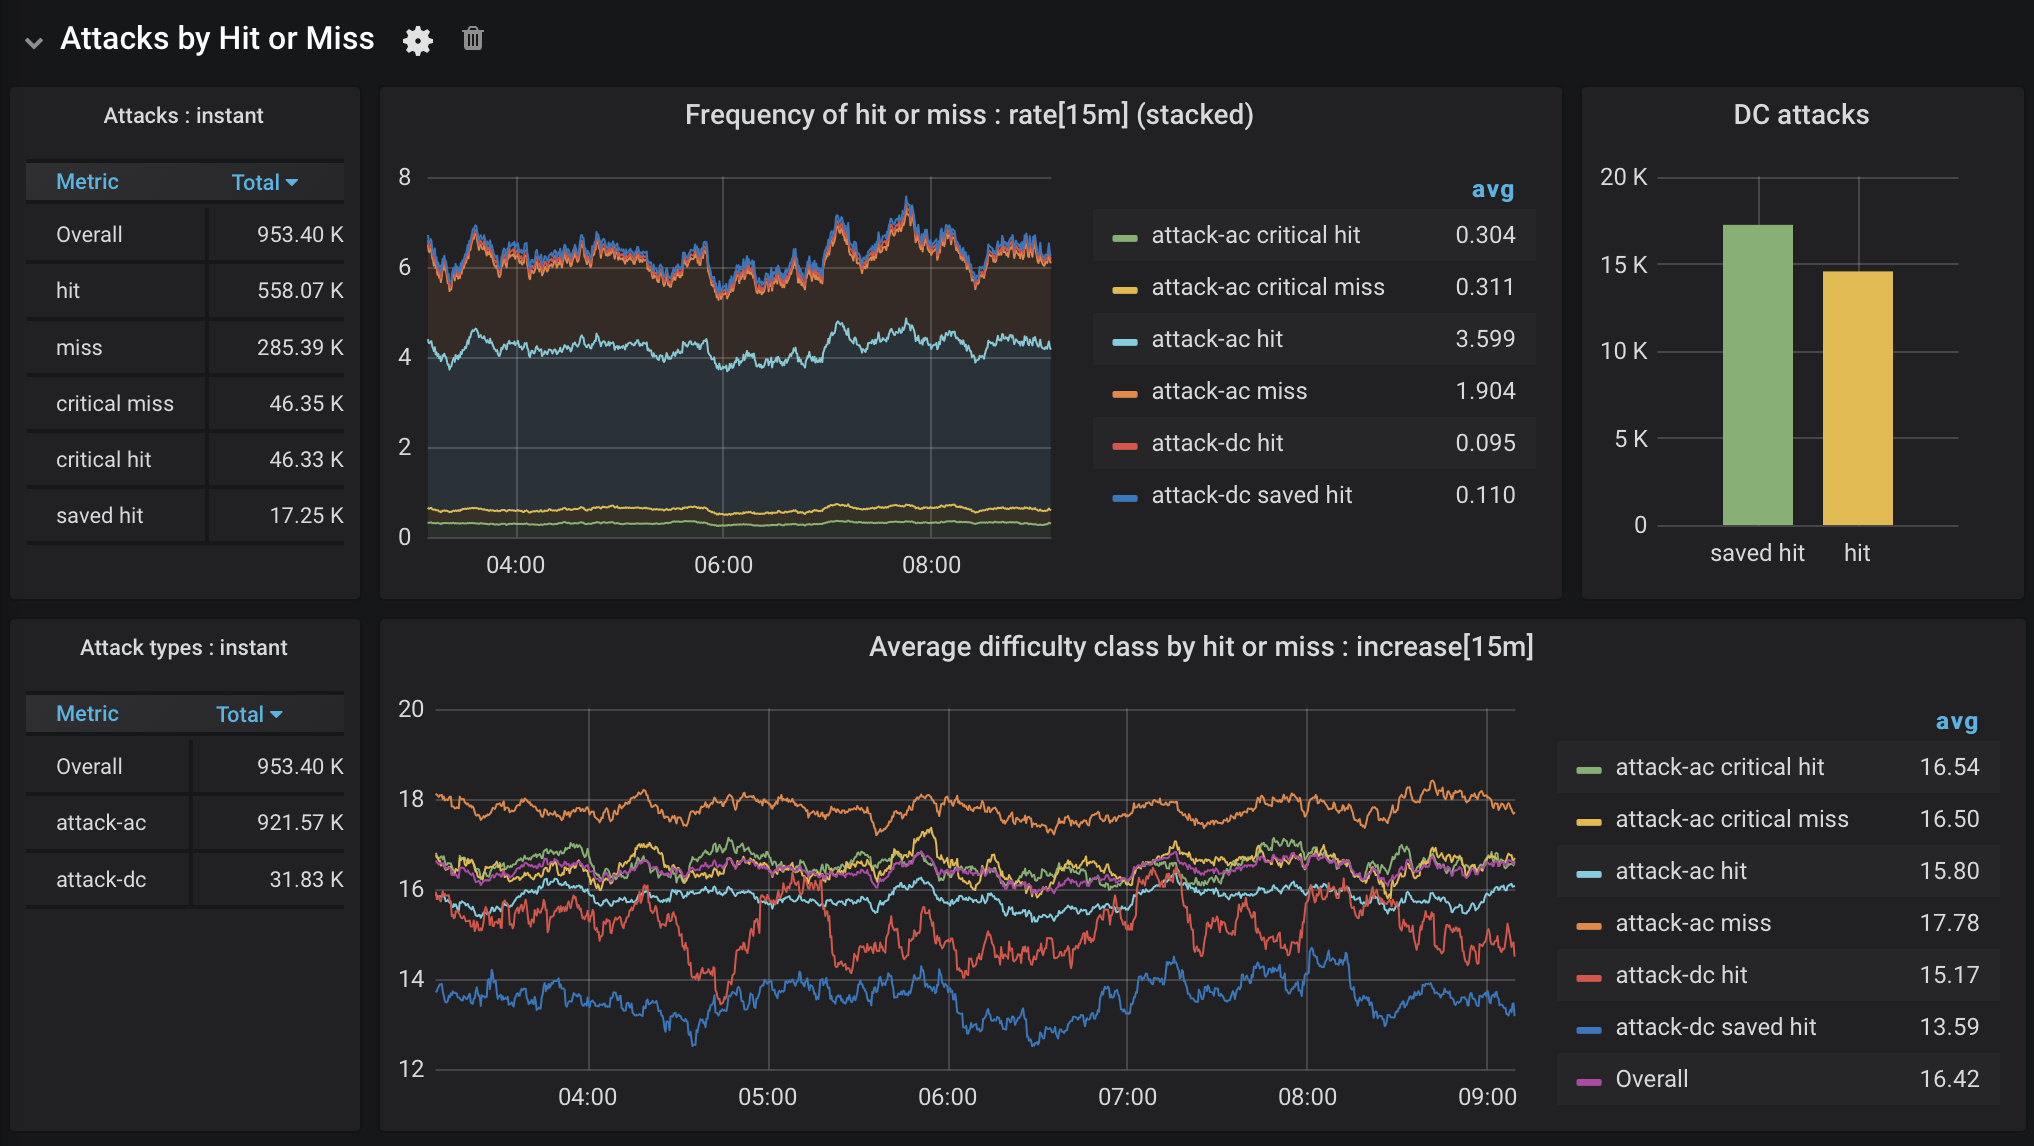
Figure 5. Attack success, take 3
What does this dashboard tell me? Attacks hit more often than not. Critical hits and critical misses are equally unlikely, as expected. While attacks requiring a saving throw (attack-dc) aren’t frequent, they are saved more often than not.
Looking at the bottom graph, the average difficulty or armor class for hits and misses matches what you would expect: attacks that hit succeeded against a fairly low AC, and vice versa for misses. The frequency of saved hits is also explained by a very low average DC. The difficulty class for critical hits and misses tracks with the overall average, which makes sense as they are determined entirely by the roll (a 20 succeeds and a 1 fails).
Damage
What about damage? What is the average amount of damage in any given attack? Are some kinds of damage consistently higher than others? To answer these kinds of questions, I created another distribution summary that recorded the damage caused by an attack, tagged with whether or not it hit, if it was an AC (weapon-style) or DC (spell-style) attack, and what kind of damage it was (bludgeoning, piercing, etc.):
registry.summary("round.attacks",
        "hitOrMiss", event.hitOrMiss(),
        "attackType", event.getAttackType(),
        "damageType", event.getType())
        .record((double) event.getDamageAmount());
The resulting prometheus data looks something like this very abridged example:
 # HELP round_attacks
# TYPE round_attacks summary
round_attacks_count{attackType="attack-ac",damageType="bludgeoning",hitOrMiss="hit",} 49.0
round_attacks_sum{attackType="attack-ac",damageType="bludgeoning",hitOrMiss="hit",} 684.0
round_attacks_count{attackType="attack-ac",damageType="fire",hitOrMiss="miss",} 6.0
round_attacks_sum{attackType="attack-ac",damageType="fire",hitOrMiss="miss",} 0.0
miss",} 0.0
round_attacks_count{attackType="attack-ac",damageType="slashing",hitOrMiss="critical hit",} 9.0
round_attacks_sum{attackType="attack-ac",damageType="slashing",hitOrMiss="critical hit",} 216.0
round_attacks_count{attackType="attack-ac",damageType="fire",hitOrMiss="hit",} 2.0
round_attacks_sum{attackType="attack-ac",damageType="fire",hitOrMiss="hit",} 41.0
...
# HELP round_attacks_max
# TYPE round_attacks_max gauge
round_attacks_max{attackType="attack-ac",damageType="bludgeoning",hitOrMiss="hit",} 31.0
round_attacks_max{attackType="attack-ac",damageType="fire",hitOrMiss="miss",} 0.0
round_attacks_max{attackType="attack-ac",damageType="slashing",hitOrMiss="miss",} 0.0
round_attacks_max{attackType="attack-ac",damageType="fire",hitOrMiss="critical hit",} 30.0
round_attacks_max{attackType="attack-ac",damageType="slashing",hitOrMiss="critical miss",} 0.0
round_attacks_max{attackType="attack-ac",damageType="slashing",hitOrMiss="critical hit",} 32.0
round_attacks_max{attackType="attack-ac",damageType="fire",hitOrMiss="hit",} 22.0
round_attacks_max{attackType="attack-ac",damageType="slashing",hitOrMiss="hit",} 24.0
...
Creating data like this makes you appreciate the cardinality of labels in dimensional time series data. While damage type is a bounded set, it has many more possible values than either hitOrMiss or attackType do, resulting in many more unique permutations. When this set was combined with additional labels added by Prometheus for service/job instances, Grafana struggled. I ended up using Prometheus reporting rules to emit a new time series containing the per-second average rate of increase in the amount of damage over a period of time (15 minutes). As an aside, this also demonstrates the implications of aggregation: it is impossible to work backwards from this rate, which is calculated based on input from multiple sources, to an individual recorded result. If I needed to do that, I would need to use log entries or distributed tracing, which is why they are also essential elements in the overall of the observability story. But I digress.
The dashboard in Figure 6 has two plots showing the “increase” in the damage value over 15 minutes within the last 6 hours based on the attack type. The increase value is calculated by multiplying the rate value by the time interval, which places the values back into a human readable/relatable scale (the y-axis).
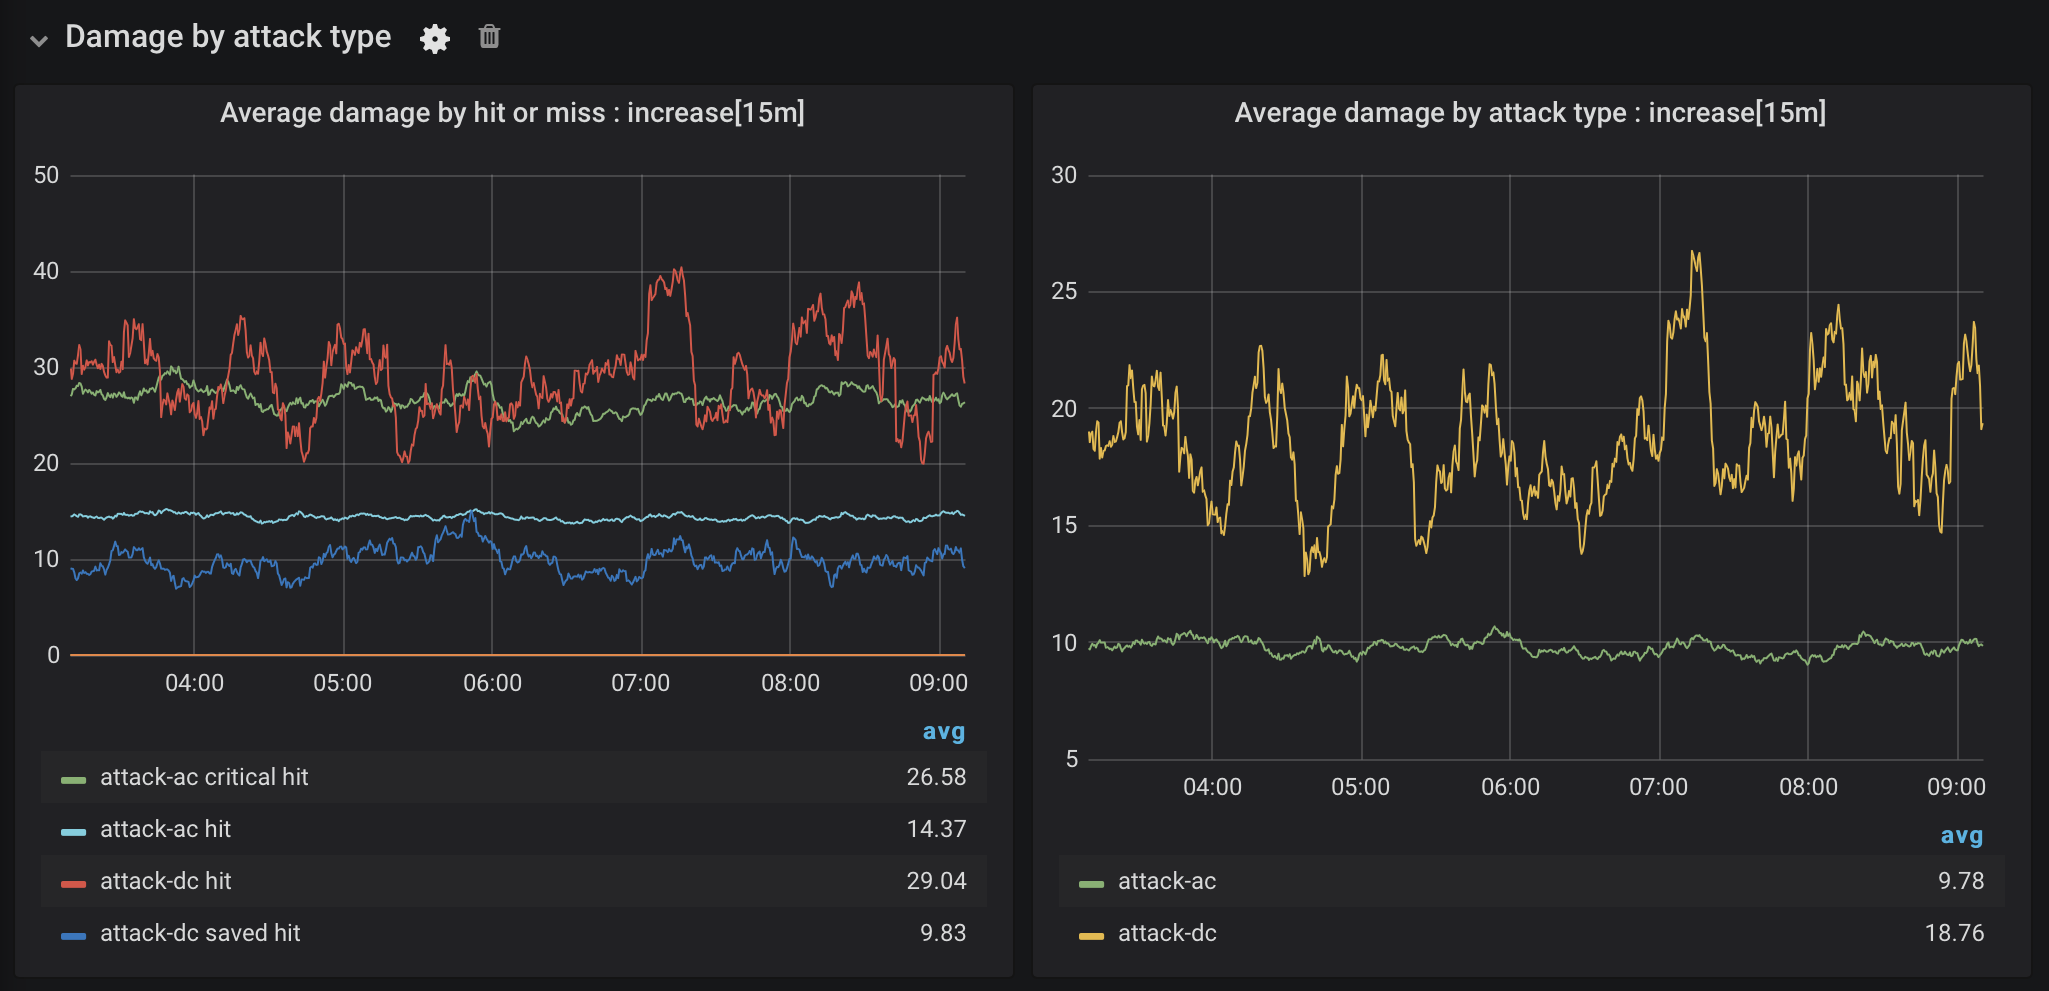
Figure 6. Damage for each attack type
The graphs in this dashboard show that the average amount of attack damage matches what we would expect for the attack type: the average damage for a critical hit is double the average damage for a regular hit with weapon-style attacks against the AC of the target. While the average damage for spell-style attacks against a DC is more variable, a save does reduce damage by half, also as expected. What I had not previously realized was that these attacks are basically critical hits by default. Ouch! It’s a good thing that they are both comparatively rare and are saved more often than not.
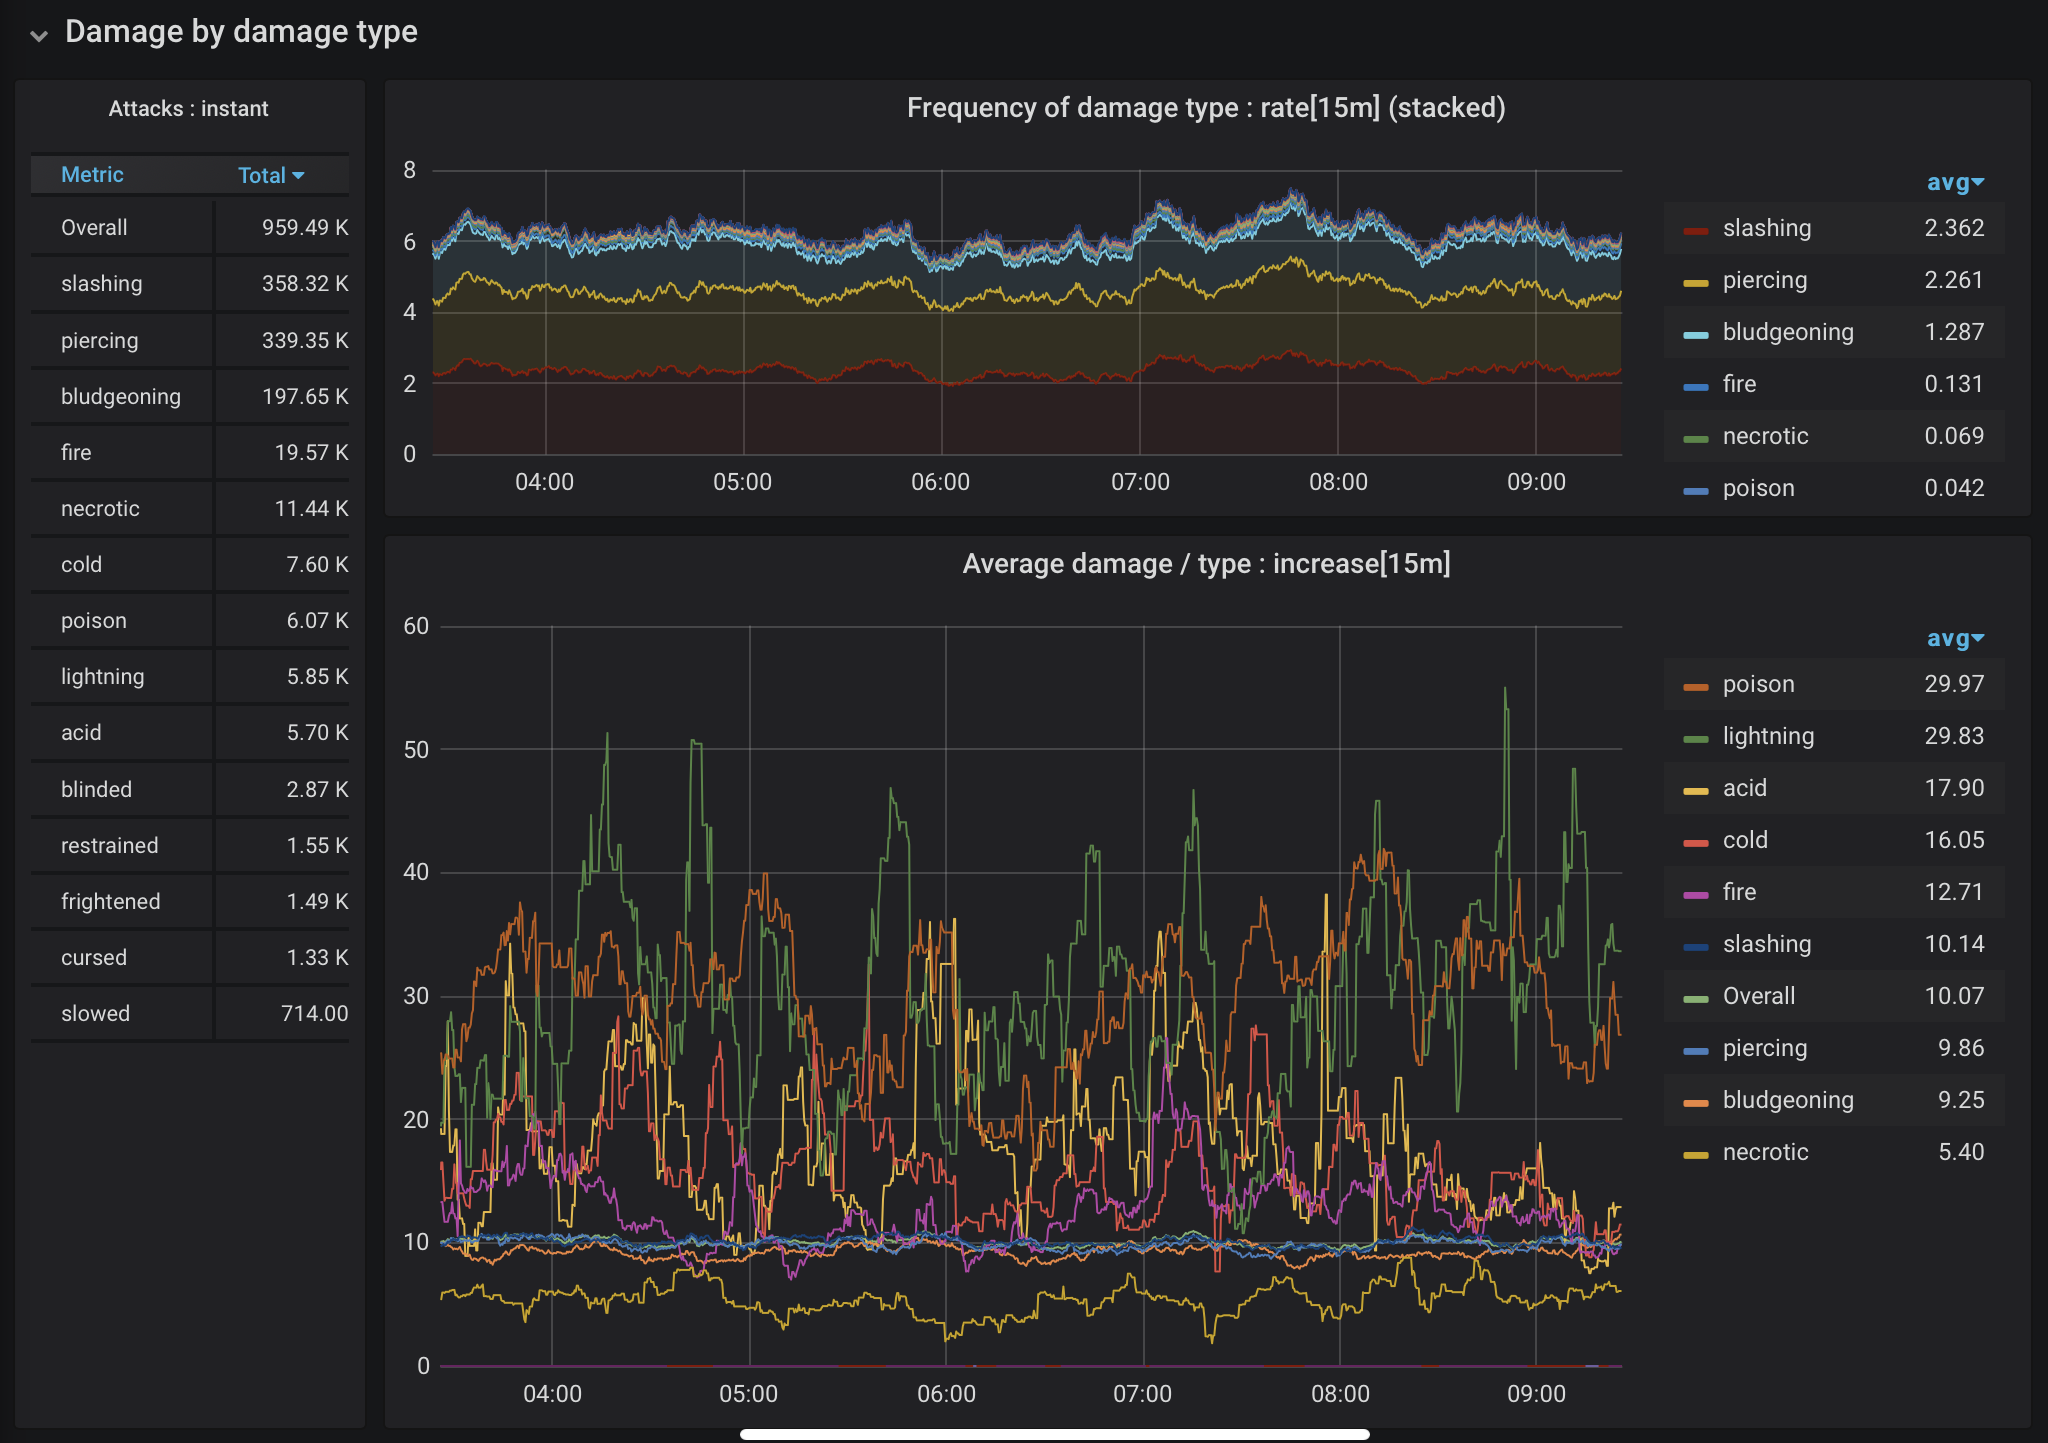
Figure 7. Damage by damage type
What types of damage are the most common? Which are the most harmful? We can use different dimensions of the same data to create the dashboard shown in Figure 7. These graphs show that while poison and lightning attacks are comparatively rare, they are disproportionately damaging. Slashing, piercing, and bludgeoning types, the most common types of damage, cluster around the average, with much less variation in how much damage they cause than other types.
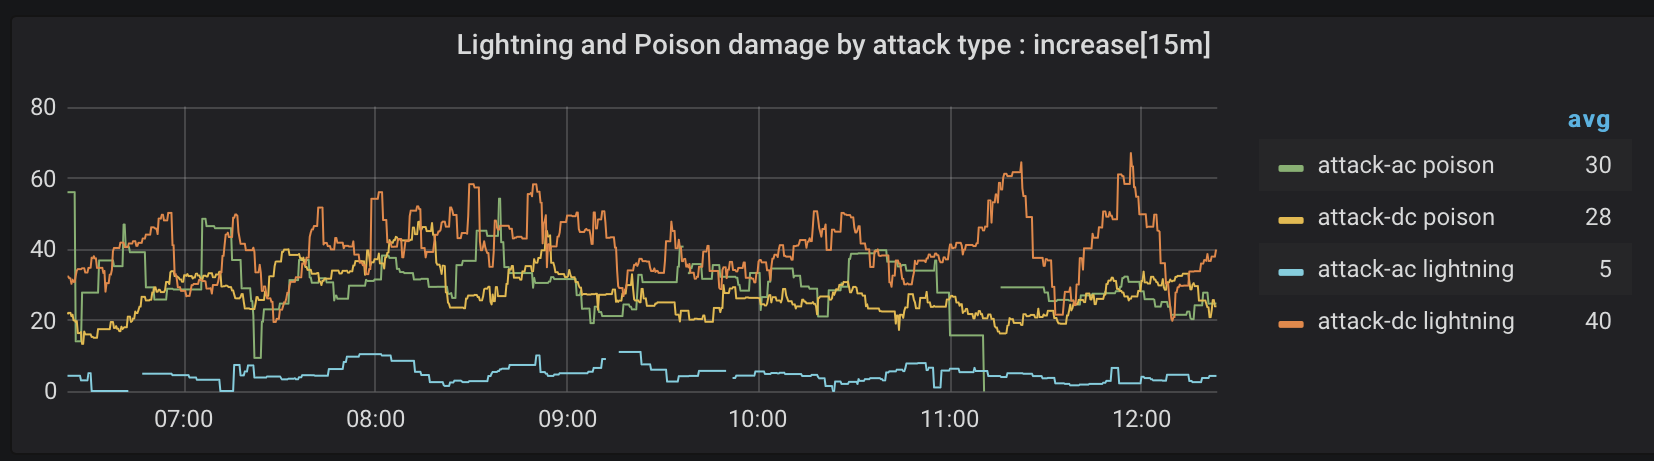
Figure 8. Poison and lightning damage by attack type
Figure 8 focuses on attacks causing poison and lightning damage. Most lightning damage comes from attacks requiring a saving throw (dexterity). Poison damage, on the other hand, is dished out in pretty equal amounts from either kind of attack.
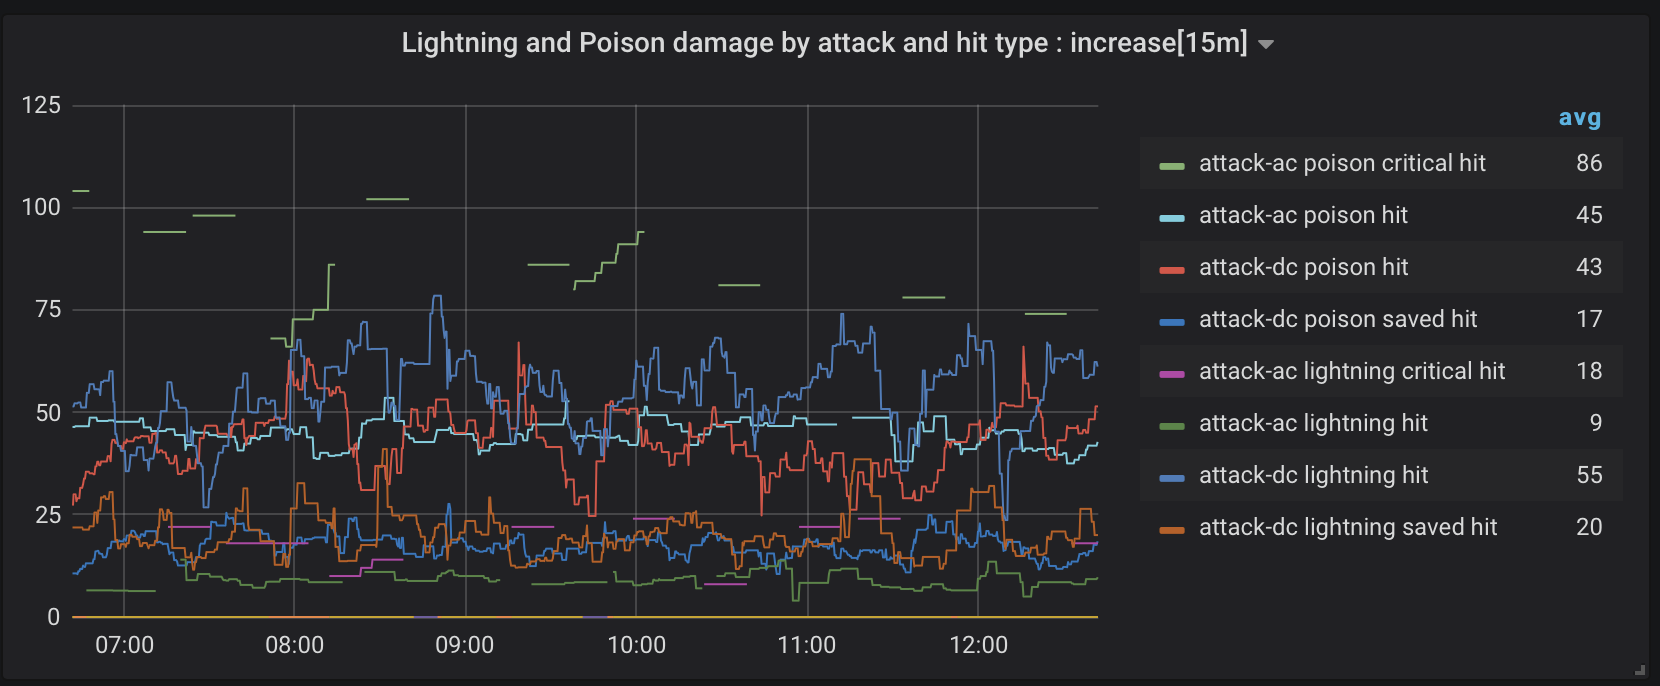
Figure 9. Poison and lightning damage by attack and hit type
Figure 9 further distinguishes critical and saved hits for poison and lighting damage attacks. There are some skips or gaps in the data, as we’re looking at a narrow combination of factors that don’t always occur together. I draw a few broad brush conclusions from that graph. A critical hit with poison damage is going to hurt and there is not much you can do about it. The average amount of poison damage for a saved hit is something low-level characters can survive. A decent constitution modifier for starting characters is a good plan. Also, if you don’t have a decent dexterity modifier, avoid clashing with monsters that hurl lighting.
Some attacks impose conditions instead of doing damage. Conditions are present in the raw count of occurrences on the left in Figure 7, but the resulting effects don’t show up in a raw representation of damage in a useful way. The combat engine needs to handle conditions better generally, which might allow conditions get separated out into their own category to better understand their impact on combat encounters. Some imposed conditions constrain or prevent the use of multiple attacks during a turn, for example. What impact does that have? So many things to play with on future rainy days!
Combat encounters and rounds
Aside from looking at the behavior of dice, there wasn’t much in the previous sections that my husband would call “actionable” data. Let’s flip over now to look at data more directly influenced by implementation choices: the number of rounds in each encounter. At the end of an encounter, the number of rounds is recorded into another distribution summary:
 registry.summary("encounter.rounds",
                "numCombatants", label(e.getNumCombatants()),
                "targetSelector", e.getSelector(),
                "sizeDelta", label(e.getSizeDelta()))
                .record((double) totalRounds);
If you haven’t noticed, I am using distribution summaries most of the time, as that provides both a count and a sum that I can use to aggregate across sources and calculate averages. I also get a maximum value, but from an overall trend perspective, I find that less interesting. The data gathered in this summary looks like this:
 # HELP encounter_rounds
# TYPE encounter_rounds summary
encounter_rounds_count{numCombatants="05",sizeDelta="05",targetSelector="HighestHealth",} 18.0
encounter_rounds_sum{numCombatants="05",sizeDelta="05",targetSelector="HighestHealth",} 136.0
encounter_rounds_count{numCombatants="04",sizeDelta="00",targetSelector="LowestHealth",} 7.0
encounter_rounds_sum{numCombatants="04",sizeDelta="00",targetSelector="LowestHealth",} 58.0
encounter_rounds_count{numCombatants="05",sizeDelta="02",targetSelector="LowestHealth",} 86.0
encounter_rounds_sum{numCombatants="05",sizeDelta="02",targetSelector="LowestHealth",} 775.0
encounter_rounds_count{numCombatants="06",sizeDelta="03",targetSelector="SmallestFirst",} 91.0
encounter_rounds_sum{numCombatants="06",sizeDelta="03",targetSelector="SmallestFirst",} 935.0
encounter_rounds_count{numCombatants="03",sizeDelta="00",targetSelector="Random",} 22.0
encounter_rounds_sum{numCombatants="03",sizeDelta="00",targetSelector="Random",} 157.0
encounter_rounds_count{numCombatants="04",sizeDelta="02",targetSelector="Random",} 95.0
encounter_rounds_sum{numCombatants="04",sizeDelta="02",targetSelector="Random",} 654.0
encounter_rounds_count{numCombatants="05",sizeDelta="04",targetSelector="Random",} 35.0
encounter_rounds_sum{numCombatants="05",sizeDelta="04",targetSelector="Random",} 261.0
encounter_rounds_count{numCombatants="05",sizeDelta="01",targetSelector="SmallestFirst",} 42.0
encounter_rounds_sum{numCombatants="05",sizeDelta="01",targetSelector="SmallestFirst",} 398.0
To explain the labels:
- numCombatants should be self explanatory as the number of creatures in the encounter.
- sizeDelta is the difference in size between the largest creature and the smallest creature in the encounter. The maximum value (5) occurs when a gargantuan creature (5) faces a tiny creature (0). The delta is padded into a two character value string.
- targetSelector contains a representation of one of a few ways I allowed creatures to select the target for their attacks: HighestHealth, LowestHealth, BiggestFirst, SmallestFirst, Random, and Faceoff (when there are only 2 combatants)
From this gathered data, we can look at how certain factors influence the number of rounds per encounter. My own theory was that encounters with more combatants would have more rounds, on average, than those with fewer combatants. Safe bet, right? Let’s look at the dashboard in Figure 10.
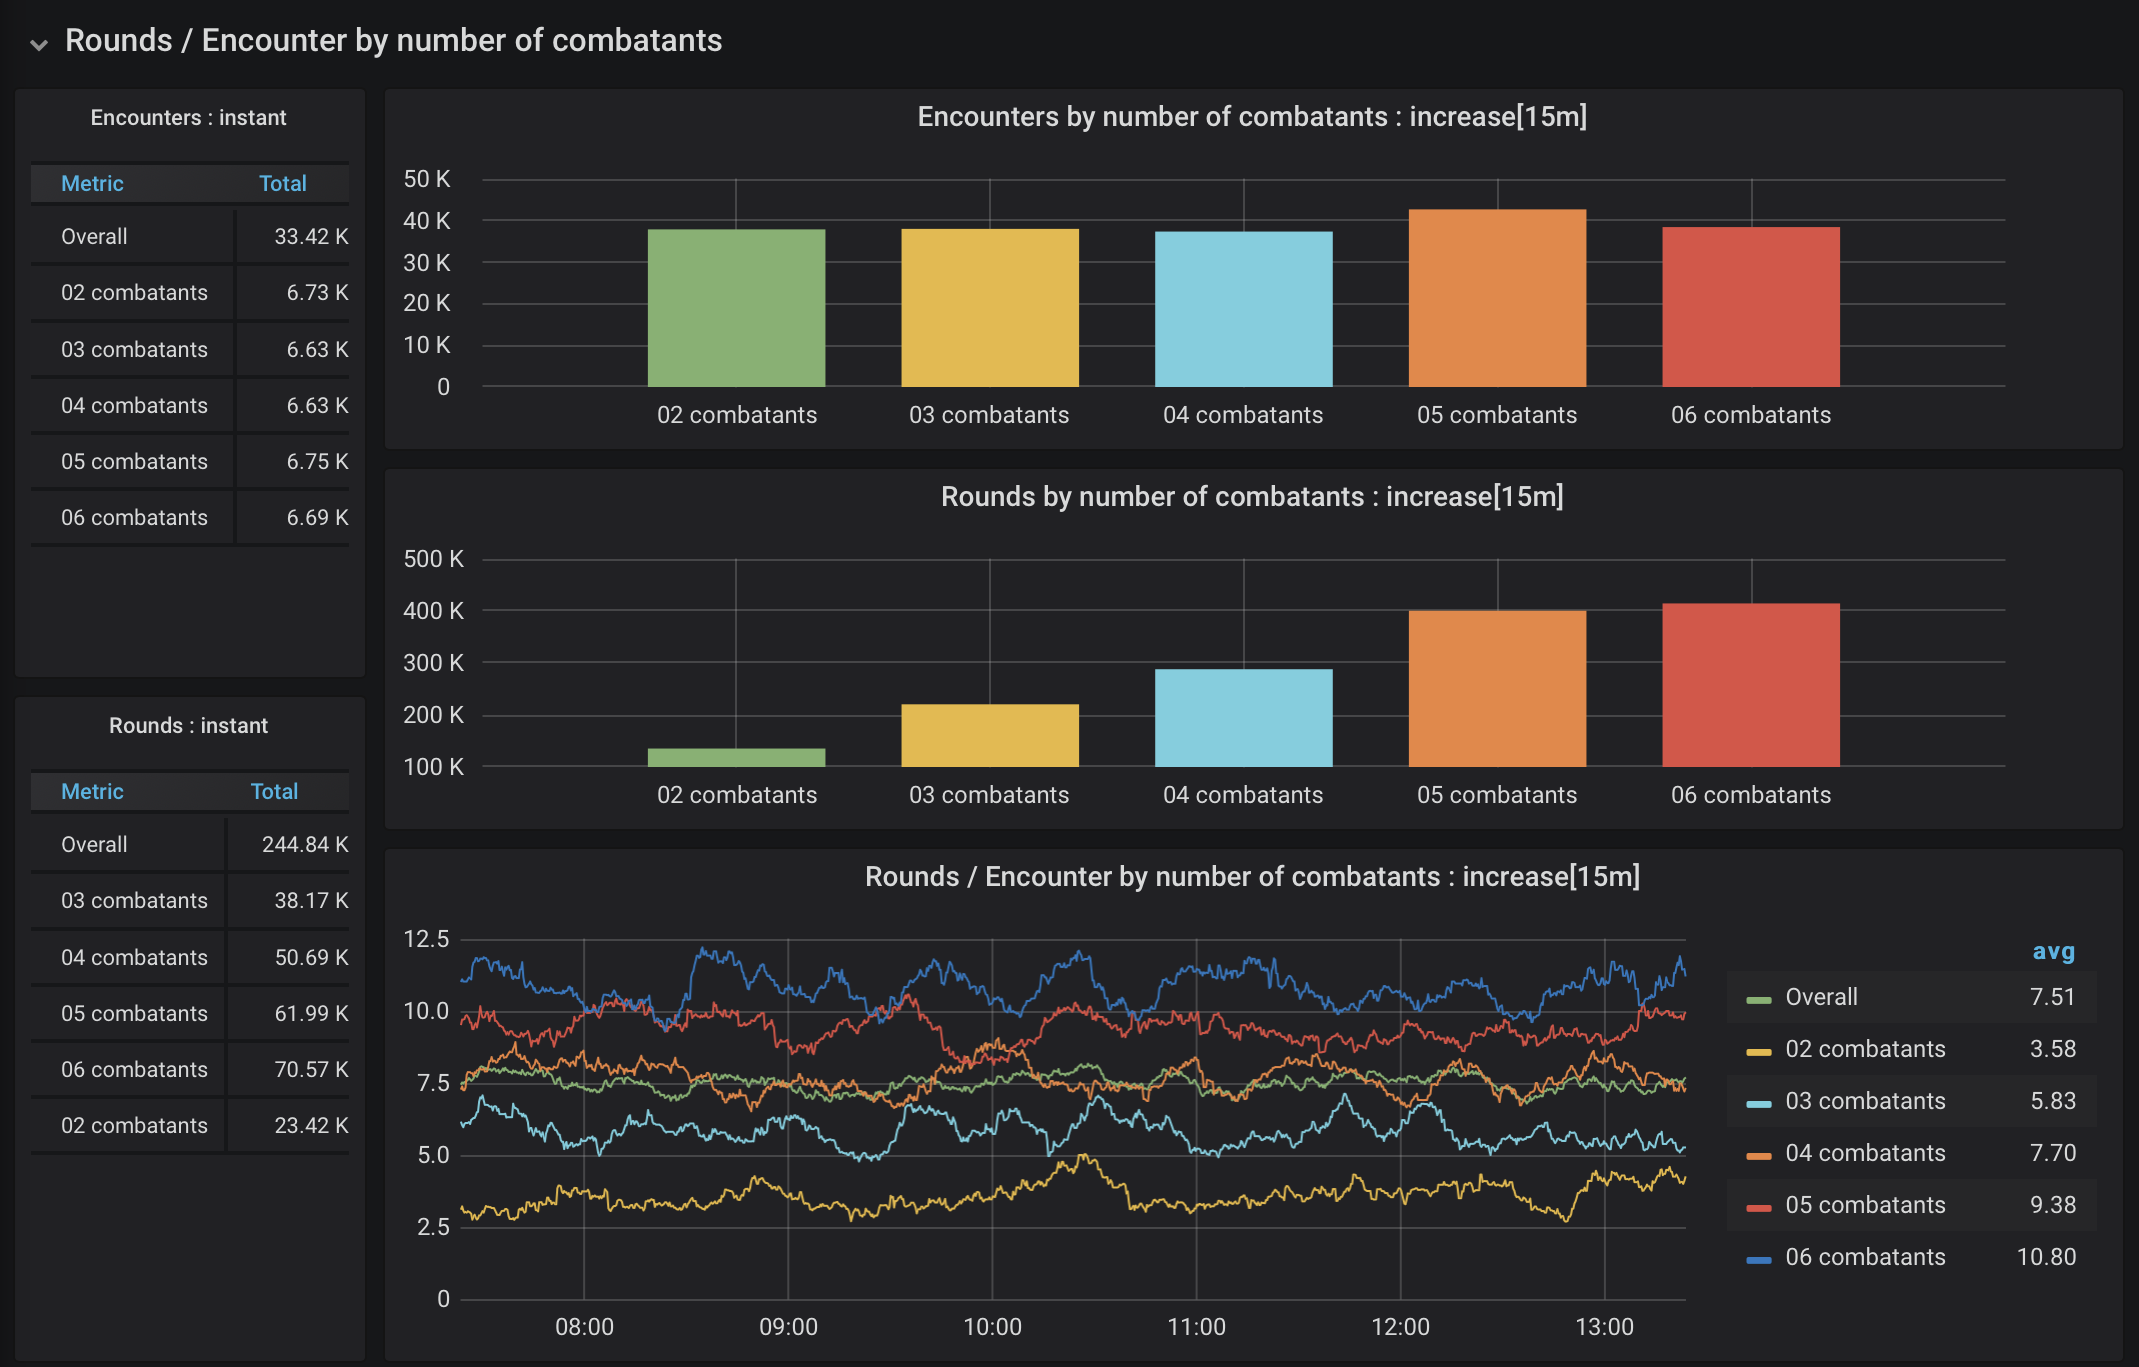
Figure 10. Rounds per encounter by number of combatants
The hypothesis proves true, and the results are pretty consistent. The distribution of encounters across the number of combatants was pretty even, and the average number of rounds per encounter increased as you progressed from 2 combatants to 6.
What other factors might change how many rounds are in an encounter? To look at those, I focused on two subsets: encounters with 2 combatants, and encounters with 4 combatants.
In the case of two combatants, there is no question of who attacks whom. I would expect, however, that a big difference between size (a gargantuan creature against a tiny creature) would result in a very quick encounter, and the data supports that hypothesis, with some variation as shown in Figure 11.
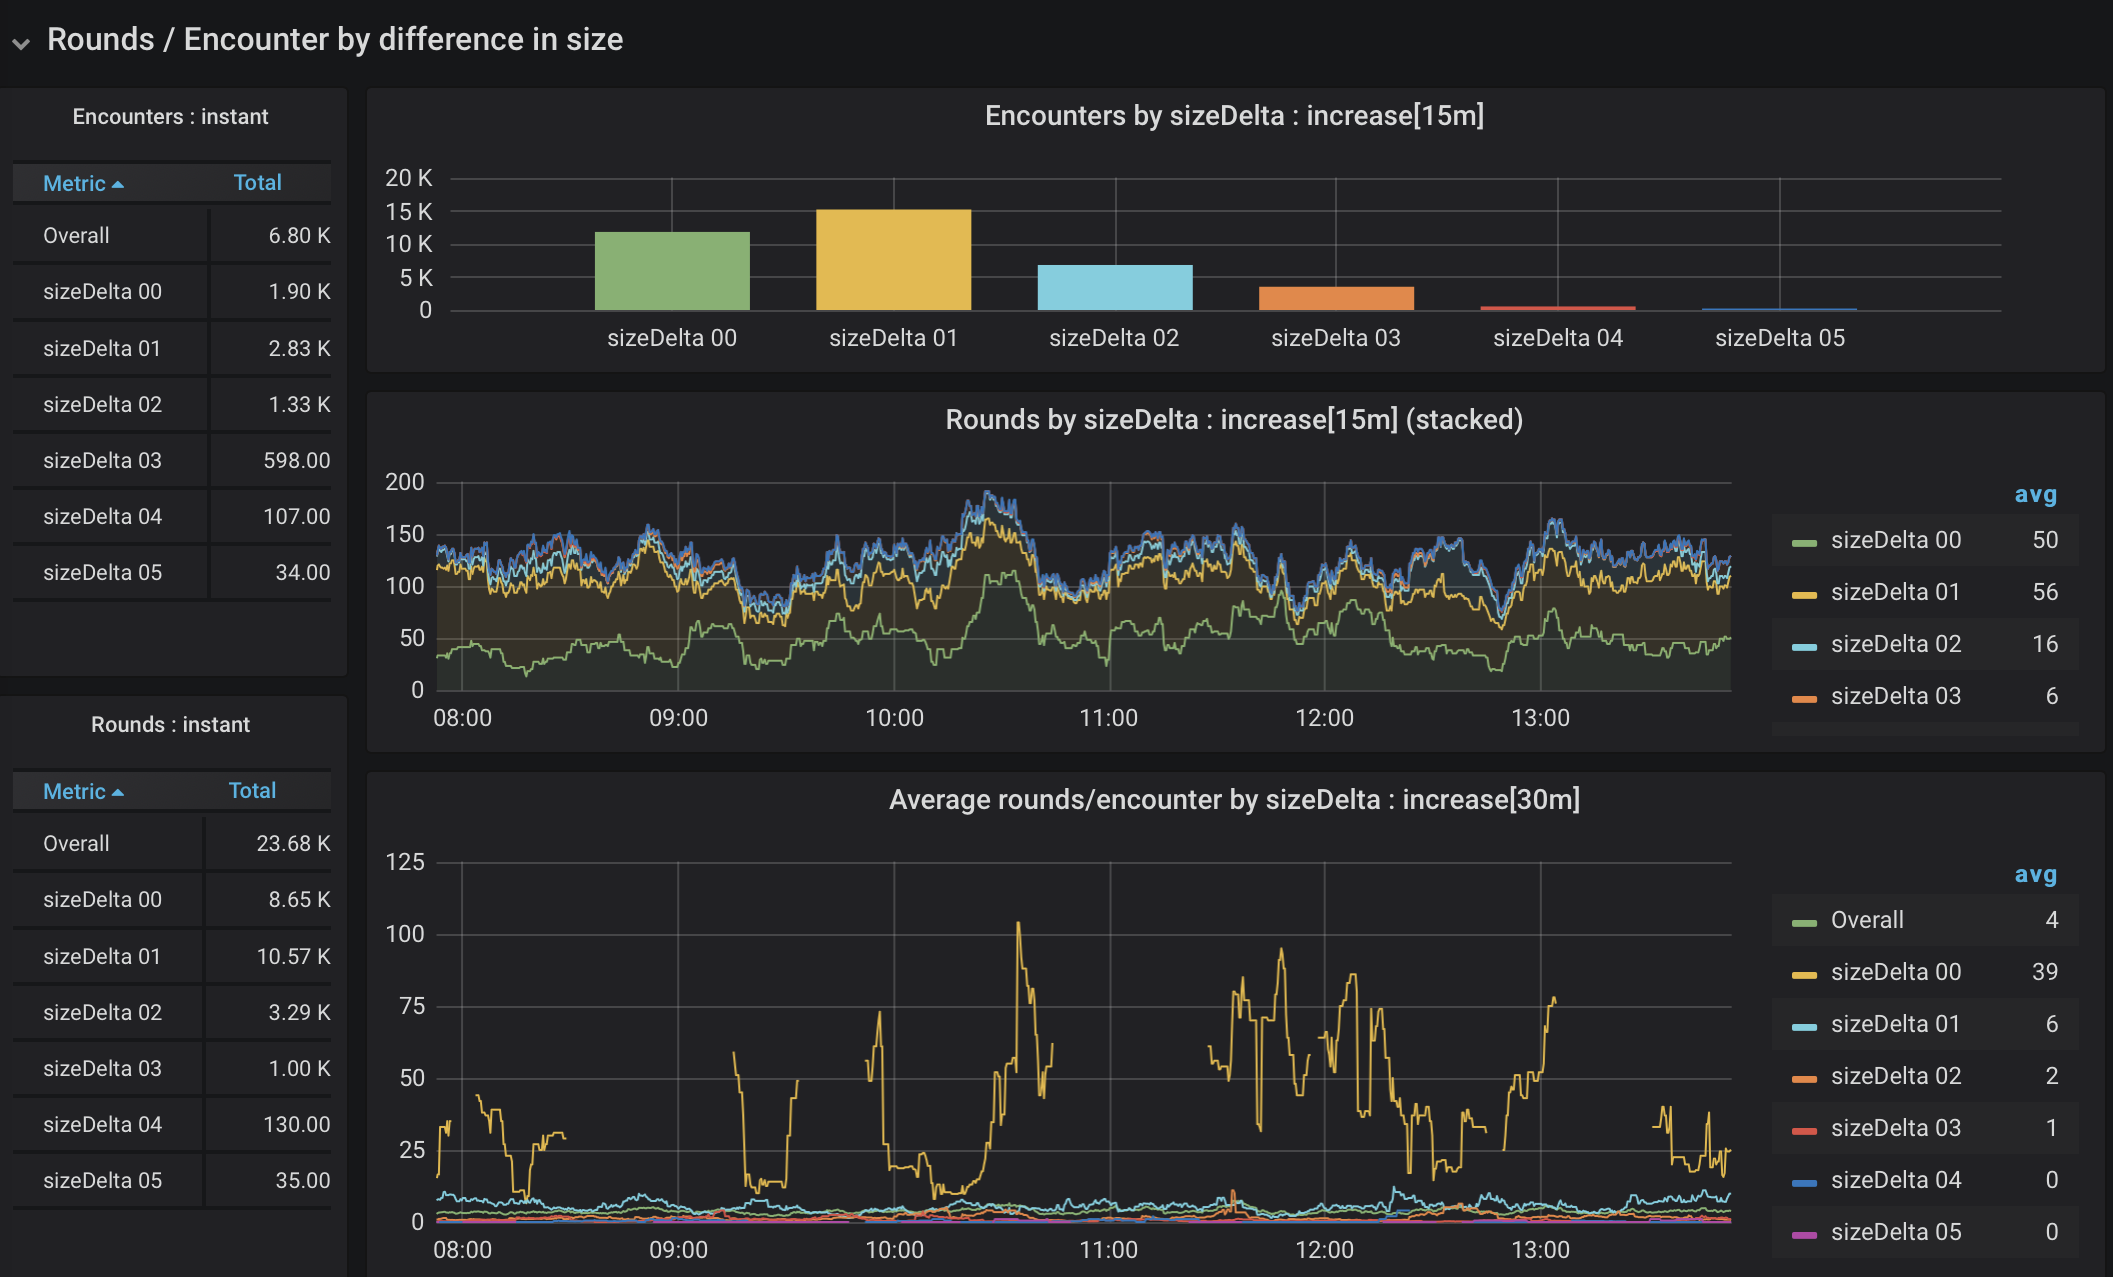
Figure 11. Rounds of 2-creature encounters by difference in size
The first thing to note is that there is an extreme skew in frequency. Most of the creatures in the bestiary are medium sized, making encounters with extreme size differences pretty rare. We’re also threading the needle again to look at a narrow slice of data (only encounters with two creatures), which makes for some gaps. That said, an encounter between two creatures of the same size has many more rounds than encounters of creatures with significantly mismatched sizes. Is the same true when there are more combatants? Let’s have a look at encounters with 4 combatants in Figure 12.
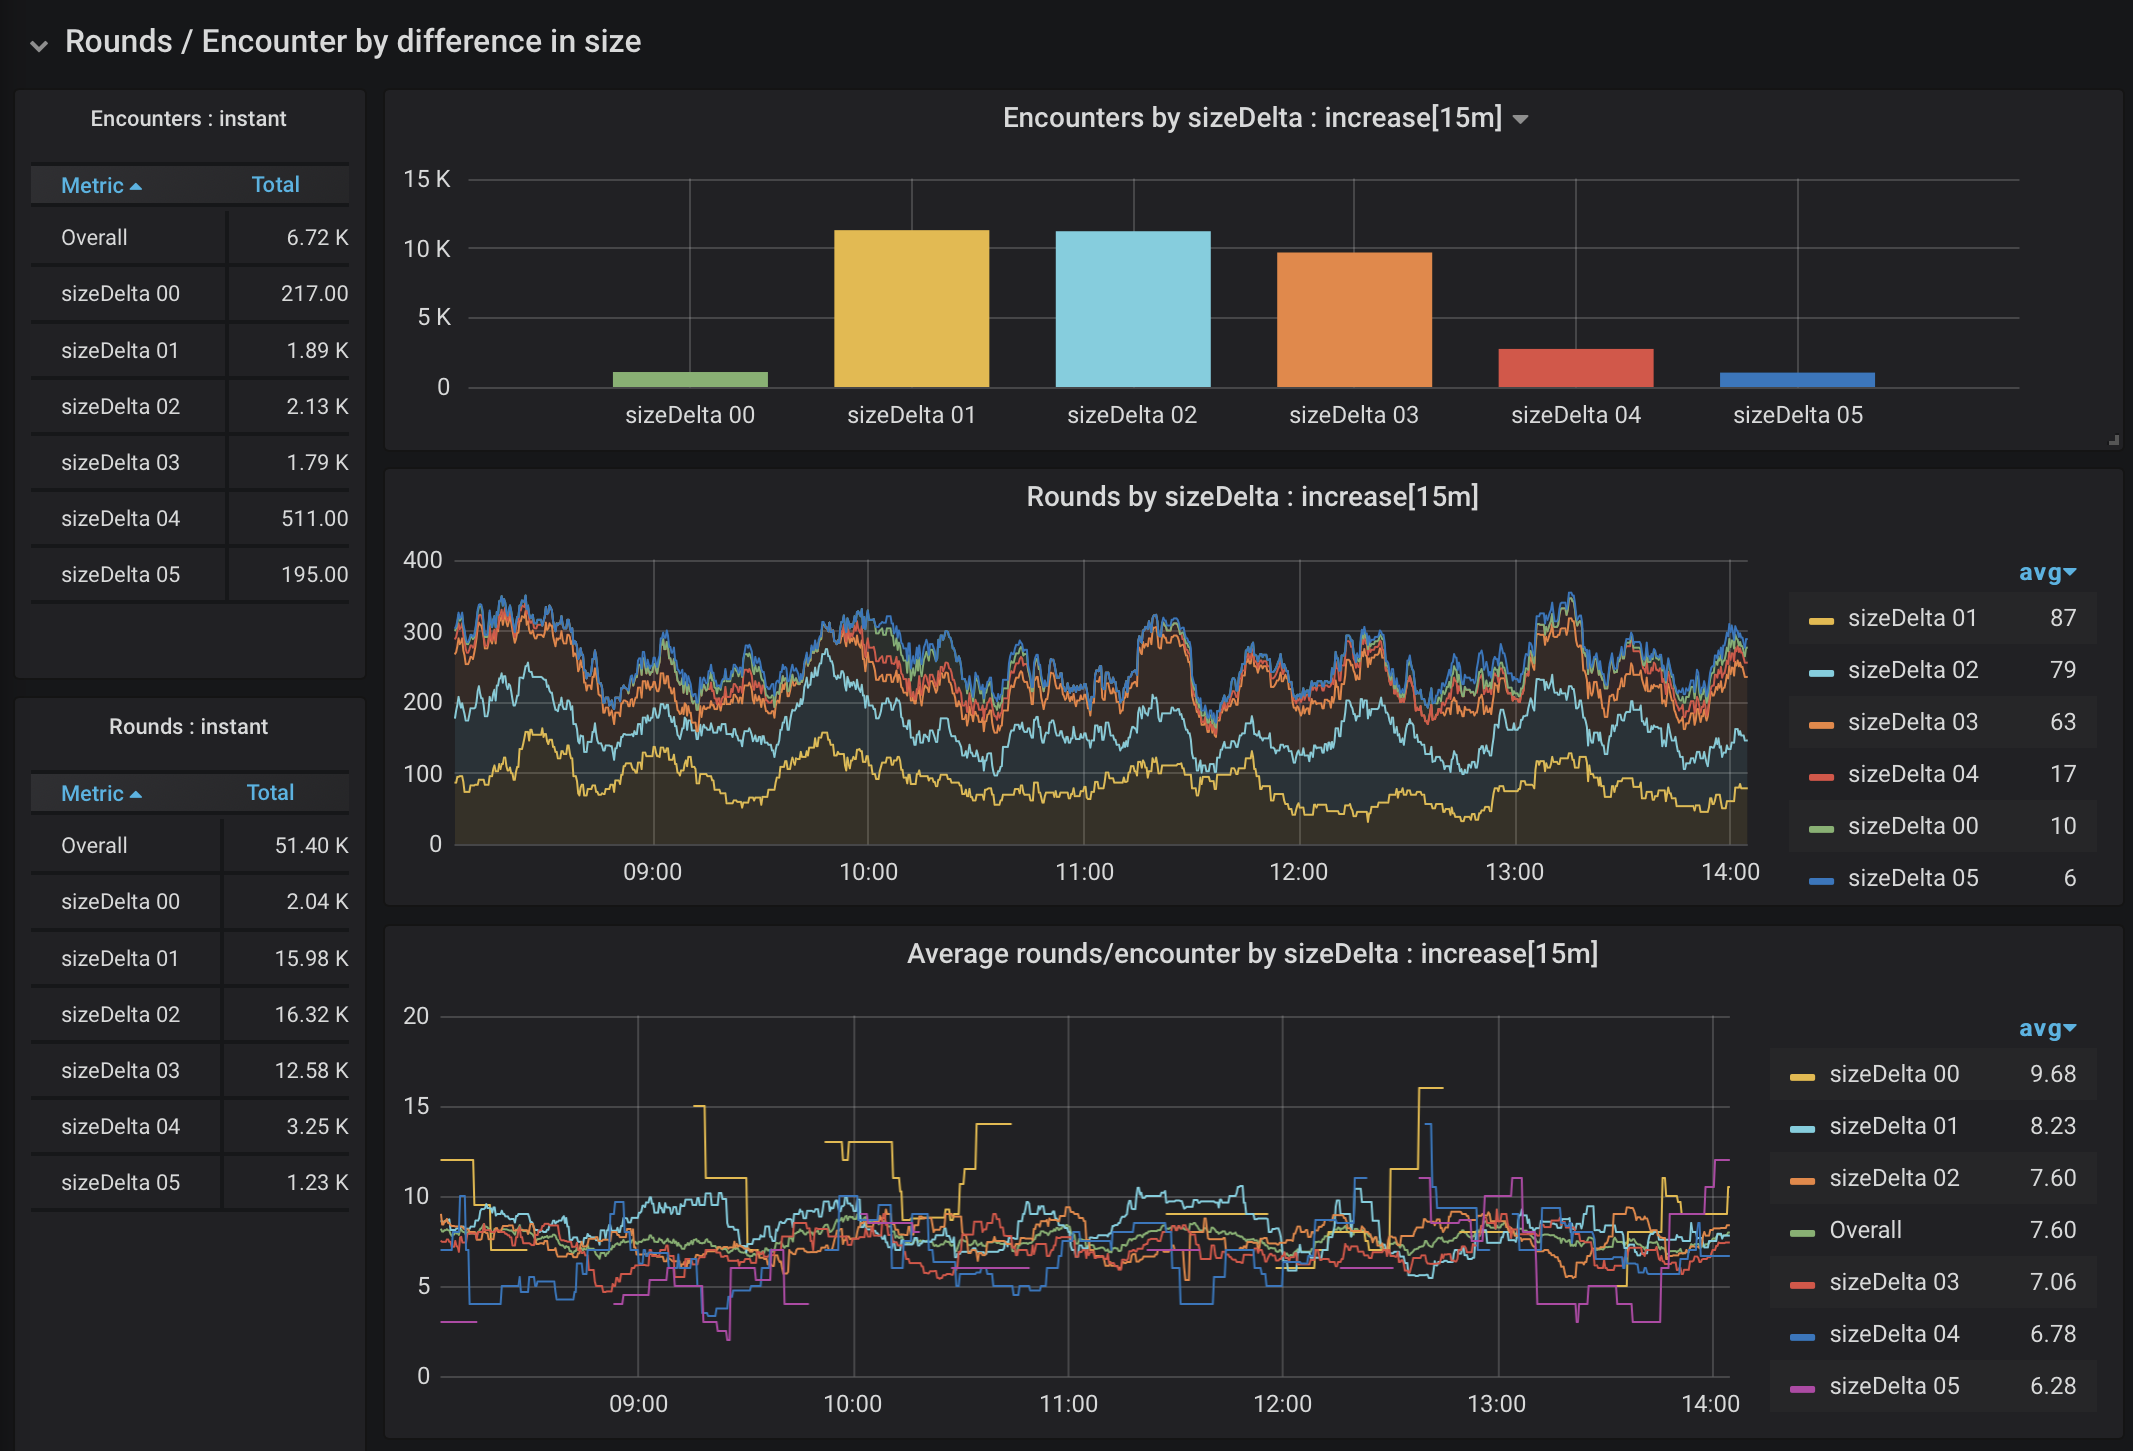
Figure 12. Rounds of 4-creature encounters by difference in size
It sure is. It is sometimes nice to have your intuition confirmed. There is still a bit of skew in frequency, but encounters with monsters that are mostly the same size consistently take longer than encounters with a mismatch.
While I was writing my combat engine, I had to make a decision: how should a creature determine what other creature to attack? Does that choice make a difference? As mentioned briefly earlier, I created 5 different methods for selecting the creature to target: choosing the biggest, the smallest, the healthiest, the most injured, or any other combatant at random. The algorithm was chosen for the entire encounter. The targetSelector tag in the gathered data indicates which algorithm was used. Figure 13 shows the data for target selection methods in 4-creature encounters.
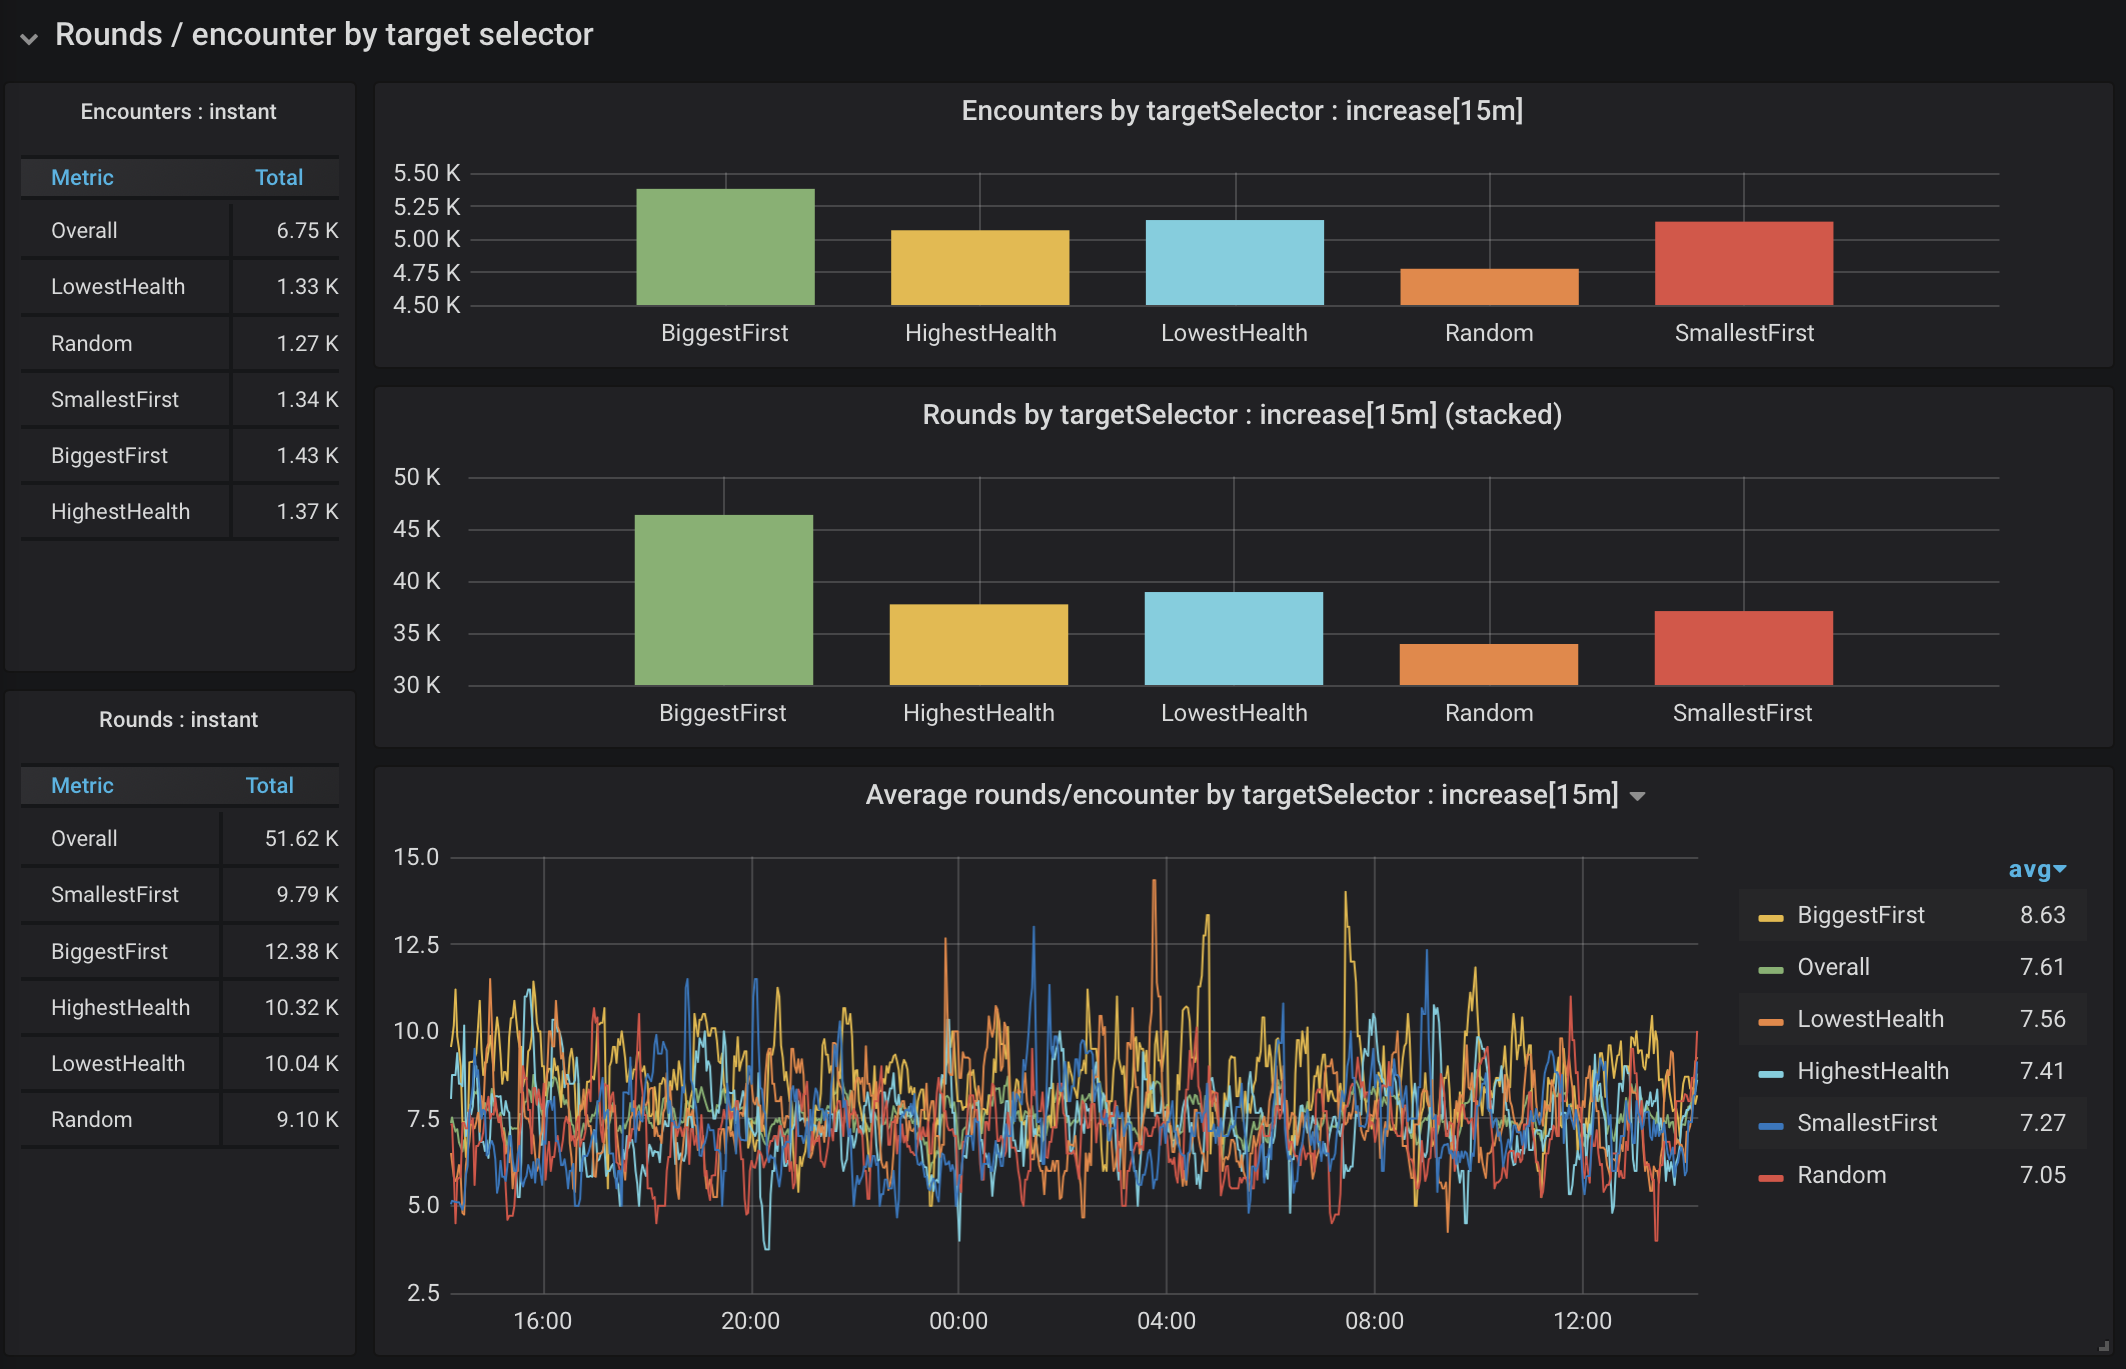
Figure 13. Rounds of 4-creature encounters by target selection
This dashboard showed me a few things. First, there was a fairly even distribution across target selection algorithms, which makes it less likely that we’ll see skewed data due to scarcity (looking at the y-axis). Looking between both cumulative rounds (the bar graph in the middle), and the plot at the bottom, I feel fairly confident saying that choosing the biggest combatant first is not a winning strategy. There is a much smaller variation between all of the others, but choosing a target at random consistently leads to shorter encounters.
In summary
I learned so much writing this application, both as a new DM trying to understand how D&D works, and as a developer going beyond cut and paste examples to use and understand the data I was gathering. Application-specific metrics found bugs that my tests didn’t, and allowed me to see the impact (or lack thereof) of implementation choices I made. In a real world scenario, metrics collection for a live service just keeps on going, providing a statistical baseline that can be used to spot behavior changes as applications are updated.
I mentioned that one of the things I’d hoped to do was compare the capabilities of metrics libraries. What I rapidly discovered was that I couldn’t. The Java library for metrics with OpenTelemetry was not-quite ready at the beginning of the year. I will give an updated version of this talk at J4K in September 2020, so I have ample time to try again.
I also ran into trouble with MicroProfile Metrics, as it emitted only pre-digested histogram values, making it impossible to use Prometheus and Grafana to calculate rates or averages from data aggregated across sources. As a result, the Quarkus application is also using micrometer. At first it used the micrometer library directly, but I later created a Micrometer Extension for Quarkus to see how far I could get in providing a first-class experience using Micrometer with Quarkus.
If you’re interested in messing with this, all of the source is in a github repository: https://github.com/ebullient/monster-combat.
Contributions and feedback are welcome.