As a core maintainer of Fluent Bit for a few years now, I wanted to pull together some notes on some questions I see come up a lot:
- How does OTEL work/can I use OTEL with Fluent Bit? TLDR; Yes!
- Kubernetes logging details and associated pitfalls: How does Fluent Bit work with Kubernetes, what things are required, what goes wrong, and how can I fix it?
This article will give you a taste of Fluent Bit with OTEL along with some detailed walkthroughs of both that and using Fluent Bit for Kubernetes observability. In each case, I will explain how things work with some pointers on usage and how to debug any issues you might encounter. I’ll provide some general advice at the end for resolving any problems you may see.
I have provided a repo via my OSS fluent.do consultancy with all the examples: https://github.com/FluentDo/fluent-bit-examples
If you want some very detailed walkthroughs of different observability deployments and use cases then my friend Eric Schabell also provides a full set of examples here: https://gitlab.com/o11y-workshops
The article will introduce some terms then dive into various examples which you can jump to directly using the links below.
Clarifying terminology
First, some definitions and introductions for those who may not be familiar with the terms and tools I will be discussing. These are just an introduction and a lot more detail is easy to find across the internet, so feel free to skip to the examples if you already know what everything is.
Observability
Observability is more than just traditional monitoring of a system, which just provides a health snapshot. It is intended to provide a single investigative source of truth for the information about the system’s various components and how they are used. The goal is to be able to investigate issues or improve functionality by diving into what the system is doing across various data points.
Typically, the three “pillars” of observability are referred to as:
- Metrics: A snapshot of the current state of the system.
- Logs: A record of all events that happen in the system.
- Traces: A track of an application request as it flows through the system including the time taken for and the result of each component.
The traditional monitoring role within an observability system may alert you to a problem (e.g., CPU load metric is too high), which you can cross-reference with data from other sources (e.g., logs and traces) to determine the underlying cause.
To provide an observability system, you will need to deploy various components to first get the data, then process the data, and finally display it to the user or generate alerts for the user. This article primarily focuses on the agents at the edge that collect and process the data to send to the rest of the stack which deals with storage, querying, alerting, and visualisation.
OpenTelemetry (OTEL)
For years, vendors provided various observability solutions, each tending to be proprietary or at least hard to integrate easily. There were existing standards like syslog but generally only for distributing log data rather than handling the full set of observability requirements. Attempts were made to standardise with things like Prometheus being developed and standards like OpenMetrics before the various industry incumbents/standards/tools united into the OpenTelemetry standard (or OTEL for short).
OTEL as the standard is definitely a good idea. The concern I see with OTEL is the implementation – everyone has their own OTEL collector with different plugins/configurations/etc. There may still be some custom exporters (vendor code) used to talk to the observability backends so whilst the data may be received in OTLP format, it can use a custom exporter to send it out.
Fluent Bit
Fluent Bit started as an embedded OS variant (compiled from C code) of the larger Fluentd Ruby-based agent, with Fluent Bit focusing on lower resource usage and including every plugin in the core (rather than having to load the appropriate plugins from Ruby Gems to use them at runtime). Due to its focus on low resource usage, it has been adopted widely by almost every cloud provider and their users – running at those scales means any saving on resource usage is multiplied massively. Fluent Bit is part of the CNCF Graduated Fluentd project.
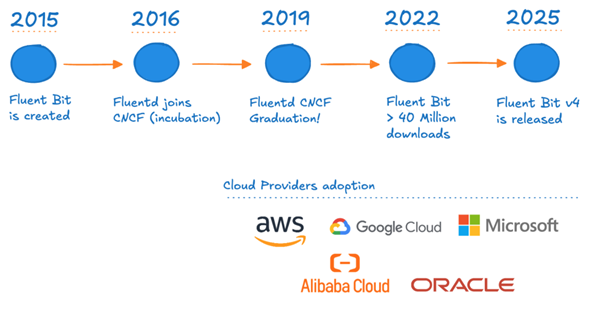
Fig. 1: Fluent Bit’s evolution from creation until v4
STAY TUNED
Learn more about DevOpsCon
STAY TUNED
Learn more about DevOpsCon
There are three main drivers for Fluent Bit:
- High performance and low resource usage.
- Vendor neutral and flexible integration – open-source with integration across ecosystems like Prometheus, OpenTelemetry and more.
- Broad ecosystem support – suitable for cloud, on-premise and edge deployments with an extensive plugin support for different data sources, destinations and processing.
Fluent Bit provides plugins for various types of inputs and outputs as well as being standards friendly and vendor agnostic. It is not limited to just working with just OTEL data, but a wide variety of sources and sinks including S3, generic HTTP, syslog and many more.
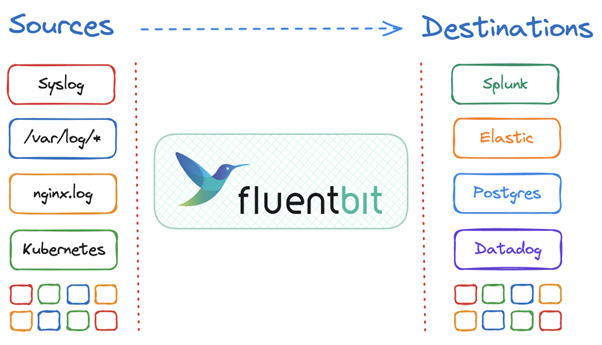
Fig. 2: Fluent Bit sources and destinations
Fluent Bit also provides various filter plugins that allow you to update, remote or add data into your pipeline as it flows through – a good example is the K8S filter which uses the K8S API to add the various metadata about the pod (annotations, labels, etc.) to the actual pod logs as they flow through the system. Other powerful filters include the ability to run any LUA script or WASM code directly on the data.
The basic Fluent Bit pipeline follows 6 primary stages:
- Input: Ingest data from a variety of sources.
- Parsing: Convert unstructured data into structured data.
- Filtering: Modify, enrich or delete any of the data.
- Buffering: Detain the now immutable data either in-memory or persist to a filesystem.
- Routing: Match data to the relevant outputs required with no duplication/copying.
- Output: Convert the internal representation to the required output format and send to the relevant destination.
The simplified diagram below shows this basic pipeline.
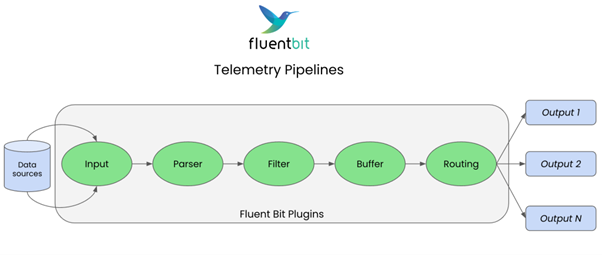
Fig. 3: Telemetry pipelines
Kubernetes Training (German only)
Entdecke die Kubernetes Trainings für Einsteiger und Fortgeschrittene mit DevOps-Profi Erkan Yanar
In Fluent Bit, we use a msgpack internal structure for all data – that means all the records follow a common structured format based on JSON key-value pairs: msgpack.org
Some metadata is associated with each event (log/metric/trace), including a timestamp and a tag.
- A tag is a specific keyword for this record that can then be selected by a match rule on filters to do some processing or outputs to select data to send to some output. Matching can be done by regex or wildcard as well to set up a full telemetry pipeline with individual filters/outputs working on a subset of the data or all of it.
- Timestamps can be extracted (parsed) from the incoming event data or be allocated by Fluent Bit as the local time the event was created. They record the time of the specific event for other components to then work with.
Therefore, all events in Fluent Bit have a common internal structure which every plugin can work with:
- Always structured into key-value pairs using msgpack
- Always has a tag
- Always has a timestamp
- Additional optional metadata
Fluent Bit uses the match keyword to connect inputs to outputs (and filters) in a telemetry pipeline. This allows you to multiplex both inputs and outputs for routing data along with more complex setups like partial regex or wildcard matching. You can have a filter or output only select a subset of data to work with. More details can be found here: https://docs.fluentbit.io/manual/concepts/data-pipeline/router
Like many other tools, initially Fluent Bit only supported log data. But now it also supports metrics and trace data both as inputs and outputs. One area of active improvement is around the processing/filtering of the metric/trace data in the pipeline to make it as rich a set of options as we have for log data.
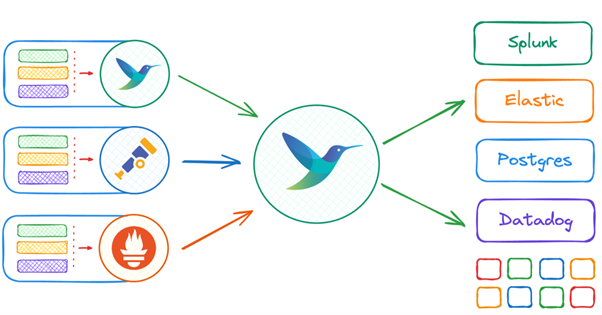
Fig. 4: Inputs and outputs
Later, I will cover some tips and tricks for debugging Fluent Bit. The official Slack channel is also very active (and predates the CNCF channel): https://slack.fluentd.org/
The official documentation covers everything in a lot more detail: https://docs.fluentbit.io/manual
Fluent Bit with OTEL
OpenTelemetry provides an open source standard for logs, metrics & traces. Fluent Bit and the OpenTelemetry collector are both powerful telemetry collectors within the CNCF ecosystem.
- Both aim to collect, process, and route telemetry data and support all telemetry types.
- They each emerged from different projects with different strengths: FB started with logs and OTEL started with traces.
- The common narrative suggests you must choose one or the other but these projects can and should coexist.
- Many teams are successfully using both by leveraging each for what it does best or for other non-functional requirements like experience with Golang vs C, ease of maintenance, etc.
The OpenTelemetry collector also has a Receiver and Exporter that enable you to ingest telemetry via the Fluent Forward protocol.
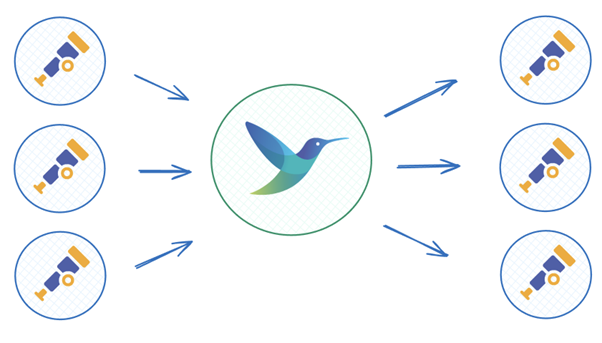
Fig. 5: Fluent Bit and OTEL
Now, I will show you various examples of how to use Fluent Bit in different deployment scenarios. We’ll demonstrate full working stacks using simple containers to make it easy to reuse the examples and pick out the bits you want to test/modify for your own use.
A repo is provided here with all examples: https://github.com/FluentDo/fluent-bit-examples
These examples are quite simple, primarily to walk you through basic scenarios explaining what is going on. There are also some other examples provided by others like https://github.com/isItObservable/fluentbit-vs-collector which may also be useful.
Fluent Bit YAML config
In each case, I will use the new (since v2.0 anyway!) YAML format rather than the old “classic” format to hopefully future proof this article while allowing you to start using the processors functionality only available with YAML configuration. The official documentation provides full details on this configuration format: https://docs.fluentbit.io/manual/administration/configuring-fluent-bit/yaml
Fluent Bit processors
A processor is essentially a filter that runs bound specifically to the input or output plugin it is associated with: this means that it only runs for the relevant data routed from that input or to that output.
Previously, filters were part of the overall pipeline so they can match any data from any other filters and inputs. They will run on the main thread to process their data. This has two benefits:
- Processors run on the thread(s) associated with their input or output plugin. This can prevent the “noisy neighbours” problem with certain input data starving out more important processing.
- Processors do not have to spend the usual cost to unpack and pack data into the generic internal msgpack format.
All existing filters can be used as processors, but there are some new processors added which cannot be used as filters. Processors are provided that work across the various logs, metrics, and trace data types, whereas filters are only provided for log type data.
Simple usage
We will run up the OTEL collector as a simple container with a Fluent Bit container feeding it OTEL dummy data as a simple test to show everything and walk through the configuration before moving on to more interesting and complex deployments. The OTEL collector is a simple OTEL receiver that is trivial to run and prove Fluent Bit is feeding it OTEL data.
OTEL collector
Start up the OTEL receiver to handle receiving OTEL data and printing it out. We use the following configuration:
receivers:
  otlp:
    protocols:
      grpc:
        endpoint: 0.0.0.0:4317
      http:
        endpoint: 0.0.0.0:4318

exporters:
  debug:
    verbosity: detailed
service:
  pipelines:
    traces:
      receivers: [otlp]
      exporters: [debug]
    metrics:
      receivers: [otlp]
      exporters: [debug]
    logs:
      receivers: [otlp]
      exporters: [debug]
Run up the container using the configuration above:
docker run -p 127.0.0.1:4317:4317 -p 127.0.0.1:4318:4318 -v $PWD/otel-config.yaml:/etc/otelcol-contrib/config.yaml otel/opentelemetry-collector-contrib:0.128.0
We open the relevant ports to receive OTEL data and tell it to mount the configuration file into the default location.
Fluent Bit sending OTEL
Now we can run up the Fluent Bit container that generates some dummy log data for now to show it all working together. We will use the following configuration:
service:
  log_level: info
pipeline:
  inputs:
    - name: dummy
      tag: test
      processors:
        logs:
          - name: opentelemetry_envelope
  outputs:
    - name: opentelemetry
      match: "*"
      host: 127.0.0.1
      port: 4318
    - name: stdout
      match: "*"
To run it up with YAML we have to mount the configuration file in and override the default command to use the YAML file rather than the classic configuration:
docker run --rm -it --network=host -v $PWD/fluent-bit.yaml:/fluent-bit/etc/fluent-bit.yaml:ro fluent/fluent-bit -c /fluent-bit/etc/fluent-bit.yaml
We’re using host networking here to simplify sending from our container to the already open localhost ports. You should connect the ports properly using dedicated networks or host/ip addresses.
There is a full compose stack here as well to simplify things: https://github.com/FluentDo/fluent-bit-examples/tree/main/otel-collector
Let’s walk through the Fluent Bit configuration to explain the various components:
service:
  log_level: info
This just sets up the top-level Fluent Bit configuration. Specifically, I added this as an example to help with debugging if you need to increase the log level.
pipeline:
  inputs:
    - name: dummy
      tag: test
      processors:
        logs:
          - name: opentelemetry_envelope
  outputs:
    - name: opentelemetry
      match: "*"
      host: 127.0.0.1
      port: 4318
      tls: off
      metrics_uri: /v1/metrics
      logs_uri: /v1/logs
      traces_uri: /v1/traces
      log_response_payload: true
    - name: stdout
      match: "*"
Here, we show a simple telemetry pipeline using the dummy input to generate sample log messages that is then routed to both an opentelemetry output (using the appropriate port and localhost address along with URIs that the collector wants) and a local stdout output. This allows us to see the generated data both on the Fluent Bit side and what’s being sent to the OTEL collector we started previously.
Opentelemetry-envelope processor
The opentelemetry-envelope processor is used to ensure that the OTEL metadata is properly set up – this should be done for non-OTEL inputs that are going to OTEL outputs: https://docs.fluentbit.io/manual/pipeline/processors/opentelemetry-envelope.
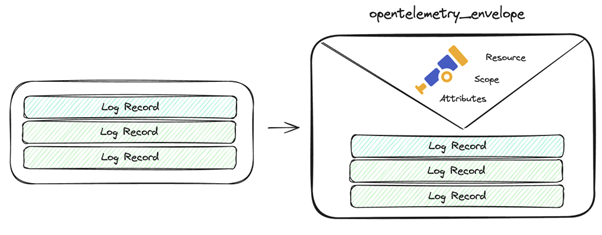
Fig. 6: Opentelemetry-envelope
Essentially, it provides the OTLP relevant information in the schema at the metadata level as attributes (rather than within the actual log data in the record) which other filters can then work with or the output plugin can use, e.g.
processors:
        logs:
          - name: opentelemetry_envelope

          - name: content_modifier
            context: otel_resource_attributes
            action: upsert
            key: service.name
            value: YOUR_SERVICE_NAME
It is usable for metrics or log type data as well.
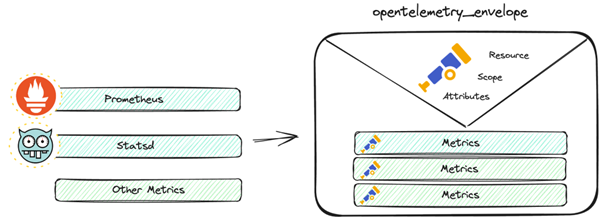
Fig. 7: Metrics
Output
You should see the Fluent Bit container reporting the generated dummy data like so:
[0] test: [[1749725103.415777685, {}], {"message"=>"dummy"}]
[0] test: [[1749725104.415246054, {}], {"message"=>"dummy"}]
The output from stdout shows first the tag we are matching test followed by the timestamp (in UNIX epoch format) and any other metadata with finally the actual logs payload being shown which in this case is the message key with the value dummy. The [0] information is to show we are reporting the first event in a batch – if there were multiple events for stdout to print then it would increment for each one until the next output.
Now, on the OTEL collector side, we should see the log messages coming in like so:
2025-06-12T10:45:04.958Z	info	ResourceLog #0
Resource SchemaURL:
ScopeLogs #0
ScopeLogs SchemaURL:
InstrumentationScope
LogRecord #0
ObservedTimestamp: 1970-01-01 00:00:00 +0000 UTC
Timestamp: 2025-06-12 10:45:04.415246054 +0000 UTC
SeverityText:
SeverityNumber: Unspecified(0)
Body: Str(dummy)
Trace ID:
Span ID:
Flags: 0
You can see the body is reported as just dummy, i.e. the message key because we only have a single top-level one. If you look at the documentation, you can see that by default the opentelemetry output looks to send the message key which is useful for demoing with dummy.
We can tweak Fluent Bit to generate a multi-key input and then pick the relevant key to send via a configuration like so:
service:
  log_level: info
pipeline:
  inputs:
    - name: dummy
      tag: test
      dummy: '{"key1": "value1", "key2": "value2"}'
      processors:
        logs:
          - name: opentelemetry_envelope
  outputs:
    - name: opentelemetry
      match: "*"
      logs_body_key: key2
      host: 127.0.0.1
      port: 4318
      tls: off
      metrics_uri: /v1/metrics
      logs_uri: /v1/logs
      traces_uri: /v1/traces
      log_response_payload: true
Using this configuration, you can see Fluent Bit reporting output like this:
[0] test: [[1749726031.415125943, {}], {"key1"=>"value1", "key2"=>"value2"}]
With the OTEL collector then receiving the key2 value:
2025-06-12T11:00:31.846Z	info	ResourceLog #0
Resource SchemaURL:
ScopeLogs #0
ScopeLogs SchemaURL:
InstrumentationScope
LogRecord #0
ObservedTimestamp: 1970-01-01 00:00:00 +0000 UTC
Timestamp: 2025-06-12 11:00:31.415125943 +0000 UTC
SeverityText:
SeverityNumber: Unspecified(0)
Body: Str(value2)
Trace ID:
Span ID:
Flags: 0
The documentation shows how to configure some of the other OTEL fields appropriately: https://docs.fluentbit.io/manual/pipeline/outputs/opentelemetry
In the basic example, we aren’t populating other useful information like SeverityText and everything else. These can be set up from the data using the various configuration options available in the documentation.
Note the configuration options let you distinguish between data in the actual log message body and data found in the metadata:
- xxx_metadata_key: Looks for the key in the record metadata and not in the log message body.
- xxx_message_key: Looks for the key in the log message body/record content.
Fluent Bit with gRPC
Fluent Bit also supports using gRPC (and HTTP/2), but these need to be explicitly enabled via the grpc or http2 configuration options. Using our previous OTEL collector listening on 4317 for gRPC data, we can do the following:
service:
  log_level: warn
pipeline:
  inputs:
    - name: dummy
      tag: test
      processors:
        logs:
          - name: opentelemetry_envelope
  outputs:
    - name: opentelemetry
      match: "*"
      host: 127.0.0.1
      port: 4317
      grpc: on
      tls: off
      metrics_uri: /v1/metrics
      logs_uri: /v1/logs
      traces_uri: /v1/traces
Now, it should send data over gRPC to the OTEL collector which reports similar output as before. I increased the log level because the current version of Fluent Bit was very “chatty” about success reporting for gRPC.
Metrics and traces
As previously discussed, Fluent Bit can handle metric and trace style data now. It can scrape metrics from prometheus endpoints, handle the prometheus write protocol, or handle OTLP metric data directly.
For a simple demonstration, we can use the fluentbit_metrics input which provides metrics about Fluent Bit itself: https://docs.fluentbit.io/manual/pipeline/inputs/fluentbit-metrics
service:
  log_level: info
pipeline:
  inputs:
    - name: fluentbit_metrics
      tag: metrics
  outputs:
    - name: opentelemetry
      match: "*"
      host: 127.0.0.1
      port: 4318
      tls: off
      metrics_uri: /v1/metrics
      logs_uri: /v1/logs
      traces_uri: /v1/traces
      log_response_payload: true
    - name: stdout
      match: "*"
    - name: prometheus_exporter
      match: metrics
      host: 0.0.0.0
      port: 2021
We provide a stdout output which will report the data in the log and an endpoint that you can scrape for Prometheus format data at port 2021 via the prometheus_exporter. The metrics are also sent to the OTEL collector we are running, which should report output like so:
StartTimestamp: 1970-01-01 00:00:00 +0000 UTC
Timestamp: 2025-06-12 12:51:52.418887897 +0000 UTC
Value: 0.000000
NumberDataPoints #1
Data point attributes:
     -> name: Str(stdout.1)
StartTimestamp: 1970-01-01 00:00:00 +0000 UTC
Timestamp: 2025-06-12 12:51:48.339675316 +0000 UTC
Value: 0.000000
Metric #30
Descriptor:
     -> Name: fluentbit_output_chunk_available_capacity_percent
     -> Description: Available chunk capacity (percent)
     -> Unit:
     -> DataType: Gauge
NumberDataPoints #0
Data point attributes:
     -> name: Str(opentelemetry.0)
StartTimestamp: 1970-01-01 00:00:00 +0000 UTC
Timestamp: 2025-06-12 12:51:52.418913562 +0000 UTC
Value: 100.000000
NumberDataPoints #1
Data point attributes:
     -> name: Str(stdout.1)
StartTimestamp: 1970-01-01 00:00:00 +0000 UTC
Timestamp: 2025-06-12 12:51:52.416704619 +0000 UTC
Value: 100.000000
Traces require something that generates OpenTelemetry format traces – the only supported trace input for the moment is from OTEL. The opentelemetry input plugin (not output) shows how to configure this, including even converting traces to log style data via the raw_traces option (e.g. to send to an endpoint that only supports log data like S3, etc. rather than OTLP trace data): https://docs.fluentbit.io/manual/pipeline/inputs/opentelemetry
There is also a useful logs_to_metrics filter, which can be used to convert log messages into metrics. Quite a common pattern found in a lot of existing applications is to log various buffer sizes, etc., which can be exposed better as metrics: https://docs.fluentbit.io/manual/pipeline/filters/log_to_metrics
Using Fluent Forward with OTEL collector
The OTEL collector can talk directly to Fluent Bit with the Fluent Forward protocol via a receiver (if sending from Fluent Bit) or an exporter (if sending to Fluent Bit). This may be a better option in some cases and is easy to configure.
The Fluent Forward protocol is also implemented by Fluentd and essentially is a msgpack based implementation that includes the tag of the data. It’s an optimal way to transfer data between Fluentd/Fluent Bit instances, since it uses the internal data structure for it all.
Sending from OTEL collector to Fluent Bit
Fluent Bit needs to receive data using a forward input plugin.
pipeline:
    inputs:
        - name: forward
          listen: 0.0.0.0
          port: 24224
    outputs:
        - name: stdout
          match: '*'
We configure the OTEL collector to have a Fluent Forward exporter to send this data.
exporters:
  fluentforward:
    endpoint:
      tcp_addr: 127.0.0.1:24224
    tag: otelcollector
Remember that the Fluent Forward protocol includes the tag, so it is not part of the input plugin.
Sending to OTEL collector from Fluent Bit
We configure the OTEL collector to have a Fluent Forward receiver to get this data.
receivers:
  fluentforward:
    endpoint: 0.0.0.0:24224
Fluent Bit needs to send data using a forward output plugin.
pipeline:
    inputs:
        - name: dummy
          tag: test
    outputs:
        - name: forward
          match: '*'
          port: 24224
Kubernetes observability
I will show a “normal” (most wildly deployed) example of using Fluent Bit to collect container logs from a K8S cluster. We can extend this to send to any output supported by Fluent Bit as well to include getting metrics and traces.
For the examples below, I am using Kubernetes-in-docker (KIND). This is a vanilla K8S distribution, so it should be applicable to all others. We also use the helm tooling, since this is the only officially supported approach: https://docs.fluentbit.io/manual/installation/kubernetes
Mounting container logs
To read the logs we have to mount them from the host so typically we deploy Fluent Bit as a daemonset with a hostPath mount to the local log files. One important thing to watch out for is dangling symlinks being mounted: make sure you mount the links and their targets if required so they can be resolved. Using the official helm chart will automatically create a daemonset with these files all mounted for you: https://github.com/fluent/helm-charts/blob/main/charts/fluent-bit
The logs being ingested should follow the K8S standard and container runtime format, Fluent Bit provides two default parsers that let you handle this file format automatically and deal with the various edge cases when lines are split by the kubelet. The documentation shows the recommended usage for containers and in general I always say to follow this – do not define your own custom parsers for the logs unless you know what you’re doing.
pipeline:
  inputs:
    - name: tail
      path: /var/log/containers/*.log
      tag: kube.*
      multiline.parser: docker, cri
In the above example, we are assuming there is a mounted set of container logs at /var/log/containers which is the default location used by the helm chart and most distributions. Then we attempt to parse with the built-in multiline parsers for the docker and cri container runtime log formats.
Previously, Fluent Bit also provided Multiline or Docker_Mode configuration options but these are deprecated now and only included for legacy usage – do not mix them with the new multiline.parser options. Instead, just use the new options.
Application-specific parsing
The parsers used above are mutually exclusive. The first one that matches will be used. They won’t be applied in order, so you cannot first do CRI format parsing then another application specific. If you want to first parse the default kubelet format and then attempt some application specific parsing, you should add a processor or filter:
parsers:
  - name: my-custom-parser
    format: json

pipeline:
  inputs:
    - name: tail
      path: /var/log/containers/*.log
      tag: kube.*
      multiline.parser: docker, cri
      processors:
        logs:
          - name: parser
            parser: my-custom-parser
            key_name: log
After we have finished processing the data in the input file, we pass it to a custom parser that operates on the log key. You can use any of the other filters/processors in the same way and apply multiple as needed.
If a parser does not apply, then the data is left alone and unchanged – there is no data loss from an invalid parser. Potentially, you can chain a series of different parsers and only those that apply will affect the data. For example, with two wildly different log formats, try one parser then the other and it will apply whichever matches first.
Preventing duplicate or missing data
One other thing you may want to consider is the fact that your pods may be evicted or have delays in scheduling for various reasons, so you should make sure that when a new pod starts it continues from wherever the last one left off. Otherwise, you may miss data since the pod started or send duplicate data that another pod has already sent. This can also be true when running an agent outside of K8S, e.g. the Fluent Bit service starts up later than something you want to track logs from.
Fluent Bit provides a way to support this by persisting the offset in the input file it last read up to with a simple sqlite database. Optionally, you can provide it with the db parameter. The db file tracks which files have been read and how much of the file so that when Fluent Bit is restarted/rescheduled/etc. it will continue from where it left off.
pipeline:
  inputs:
    - name: tail
      path: /var/log/containers/*.log
      tag: kube.*
      multiline.parser: docker, cri
      db: /var/log/fluent-bit.db
The simple example above shows how to use the same volume as the container logs to write the database file. If you want to use read only mounts for the log volume, you can use a separate volume with write access and set the path to it for the db option. This example would also work for an agent deployed directly on the node.
The sqlite database tracks files by inode value so it handles log file rotation automatically: when the file is rotated the old inode is read until completion then we carry on with the new inode for the next file. The database file can also be looked at via any sqlite tooling you may want to access it with.
The database file is not intended to be shared across processes or nodes – the inode values will not be unique for example on different nodes. Make sure that it is linked to only one Fluent Bit process at a time. You need a writable location for this database that automatically matches to the right pod each time it is started. A simple way is to use a hostPath mount so the same config is shared across all pods, but the actual filesystem is specific to each node then.
If your pod is running and persisting its file information to the database, then it is evicted and a new pod starts. The database must be linked to the new pod automatically. A hostPath can be a simple way to do this when running as a daemonset. It will always be for that specific node. Similarly, only one pod should be writing to a specific database file at a time. For other deployment options (e.g. maybe you are running as a deployment instead of a daemonset), you can figure out an alternative like using named directories or files in a persistent volume shared across all pods.
Kubernetes meta-data
Fluent Bit provides a simple Kubernetes filter you can use to automatically query the K8S API to get pod meta-data (labels and annotations) to inject into the records you are sending to your outputs. This filter will also allow you to do some additional custom parsing and other behaviour (e.g. you can ignore logs by label) on the log records it receives.
pipeline:
  inputs:
    - name: tail
      path: /var/log/containers/*.log
      tag: kube.*
      multiline.parser: docker, cri
      processors:
        logs:
          - name: kubernetes
            kube_tag_prefix: kube.var.log.containers.
This relies on the K8S standard for kubelet log filenames, which includes enough information to extract and then query the API server with. The log filename will include the namespace, pod, and container names. From this, we can make a query to the K8S API to get the rest of the metadata for that specific container in that specific pod.
To ensure that the K8S filter in Fluent Bit has this information, it must be provided the log filename in the tag. The tail input filter will do this if you provide a wildcard in the tag name, i.e. tag: kube.* will be automatically expanded to the full filename for the tag (with special characters replaced) so something like kube.var.log.containers.namespace_pod_container. The K8S filter has two configuration parameters relevant here: https://docs.fluentbit.io/manual/pipeline/filters/kubernetes#workflow-of-tail-and-kubernetes-filter
- Kube_tag_prefix: defaults to kube.var.log.containers. and is stripped off the tag to just give you the filename. This must be correct , otherwise you will get nonsense information which will fail when queried. If you change the default tag to something other than kube.* or files are mounted to a different path, you must make sure this is correct.
- Regex_Parser: this is the parser used to extract the information from the filename after it is stripped, i.e. it gets the namespace and other information. You likely do not need to change this.
Make sure you have correctly configured RBAC to allow your Fluent Bit pods to query this information from the K8S API.
If you’re seeing missing information from the kubernetes filter, the first step is to set log_level debug. This will provide the HTTP requests you’re making to the K8S API (check the pod information is correct – it’s usually down to mismatches in the tag) and the HTTP responses (which can show you invalid RBAC configuration).
Helm chart deployment
We’ll use the official helm chart to deploy Fluent Bit with the following configuration:
      service:
        # Required for health checks in the chart
        http_server: on
      pipeline:
        inputs:
          - name: tail
            tag: kube.*
            path: /var/log/containers/*.log
            multiline.parser: docker, cri
            processors:
              logs:
                - name: kubernetes
                  kube_tag_prefix: kube.var.log.containers.
                  merge_log: on
        outputs:
           - name: stdout
             match: "*"
This is a very simple standalone configuration that assumes a daemonset with a hostPath mount of /var/log, i.e. the helm chart defaults. We use the previously discussed kubernetes filter to retrieve additional information about each container log from the K8S API.
The merge_log parameter is a powerful tool to look at the log data and extract JSON key-value pairs or apply custom parsers you can specify by annotations on the pods: https://docs.fluentbit.io/manual/pipeline/filters/kubernetes#kubernetes-pod-annotations
We specify the http_server, as the helm chart defaults to enabling K8S health checks on the pods which hit that endpoint. If it isn’t present, the pods will never be marked healthy. You can disable them and then you don’t need http_server set, which will remove running an HTTP endpoint on port 2020: https://github.com/fluent/helm-charts/blob/54f30bd0c98d7ef7b7100c14d6cbd52236cb34e4/charts/fluent-bit/values.yaml#L201-L209
You can include files into an overall configuration. The include files are good ways to reuse common configuration or isolate specific configuration into separate files (e.g. for separate teams to control or to make it simpler for large configurations with well-named includes). Each configuration file is read independently and the data loaded into memory which means that you can also include “classic” configuration files into a top-level YAML configuration file or even mix-and-match:
includes:
  - yaml-include-1.yaml
  - classic-include-2.conf
This can be useful if you want to move things piecemeal a bit at a time.
One thing to note in YAML is to always quote wildcards, as they can be treated as special characters: a good tip is to quote things if you start seeing configuration format errors, just in case this is the problem.
YAML format with Helm chart
Currently the helm chart is defaulting to the old format configuration, but we can use YAML configuration with a simple values file:
config:
  extraFiles:
    fluent-bit.yaml: |
<YAML config here>

args:
  - --workdir=/fluent-bit/etc
  - --config=/fluent-bit/etc/conf/fluent-bit.yaml
We override the default configuration file to the YAML configuration we have added to the configmap used by the helm chart. This is a slight workaround in that it leaves all the legacy configuration alone and adds a new YAML one to use.
An example is provided here: https://github.com/FluentDo/fluent-bit-examples/tree/main/helm-yaml-config
We can run up a cluster with KIND then deploy the helm chart like so:
kind create cluster
helm repo add fluent https://fluent.github.io/helm-charts --force-update
helm repo update
helm upgrade --install fluent-bit fluent/fluent-bit --values ./values.yaml
Remember that with helm you can use helm template to generate you the actual YAML output (similar to what a lot of GitOps/IaC tools like Argo, etc. use to manage helm deployments) and verify it or use it directly.
Looking at the logs from the Fluent Bit pods should show you container logs with K8S metadata added: kubectl logs -l “app.kubernetes.io/name=fluent-bit,app.kubernetes.io/instance=fluent-bit”
[0] kube.var.log.containers.kindnet-vdwzr_kube-system_kindnet-cni-6c3fd58a5ca253428cbc7de0c54cb107bfac4c5b8977f29107afab415d376a4c.log: [[1749731282.036662627, {}], {"time"=>"2025-06-12T12:28:02.036662627Z", "stream"=>"stderr", "_p"=>"F", "log"=>"I0612 12:28:02.036155       1 main.go:297] Handling node with IPs: map[172.18.0.2:{}]", "kubernetes"=>{"pod_name"=>"kindnet-vdwzr", "namespace_name"=>"kube-system", "pod_id"=>"4837efec-2287-4880-8e05-ed51cc678783", "labels"=>{"app"=>"kindnet", "controller-revision-hash"=>"6cd6f98bf8", "k8s-app"=>"kindnet", "pod-template-generation"=>"1", "tier"=>"node"}, "host"=>"kind-control-plane", "pod_ip"=>"172.18.0.2", "container_name"=>"kindnet-cni", "docker_id"=>"6c3fd58a5ca253428cbc7de0c54cb107bfac4c5b8977f29107afab415d376a4c", "container_hash"=>"sha256:409467f978b4a30fe717012736557d637f66371452c3b279c02b943b367a141c", "container_image"=>"docker.io/kindest/kindnetd:v20250512-df8de77b"}}]
[1] kube.var.log.containers.kindnet-vdwzr_kube-system_kindnet-cni-6c3fd58a5ca253428cbc7de0c54cb107bfac4c5b8977f29107afab415d376a4c.log: [[1749731282.036770275, {}], {"time"=>"2025-06-12T12:28:02.036770275Z", "stream"=>"stderr", "_p"=>"F", "log"=>"I0612 12:28:02.036253       1 main.go:301] handling current node", "kubernetes"=>{"pod_name"=>"kindnet-vdwzr", "namespace_name"=>"kube-system", "pod_id"=>"4837efec-2287-4880-8e05-ed51cc678783", "labels"=>{"app"=>"kindnet", "controller-revision-hash"=>"6cd6f98bf8", "k8s-app"=>"kindnet", "pod-template-generation"=>"1", "tier"=>"node"}, "host"=>"kind-control-plane", "pod_ip"=>"172.18.0.2", "container_name"=>"kindnet-cni", "docker_id"=>"6c3fd58a5ca253428cbc7de0c54cb107bfac4c5b8977f29107afab415d376a4c", "container_hash"=>"sha256:409467f978b4a30fe717012736557d637f66371452c3b279c02b943b367a141c", "container_image"=>"docker.io/kindest/kindnetd:v20250512-df8de77b"}}]
You can see from these example logs that K8S metadata is nested under a kubernetes key.
Fluent Bit debugging tips
Even with the best tooling in the world, occasionally things go wrong and you’ll have to figure out why. My tips for debugging boil down to the usual software engineering idioms:
- Simplify your stack.
- Reproduce your issue minimally.
- Increase your log level.
- Treat warnings as errors.
Simplify
Always attempt to simplify any issues – do not debug things with a massive observability stack with components all along the way, mangling or affecting the final data you’re looking at.
Do not attempt to debug by looking at the output in another tool. Instead, use the stdout output or filter to see what the raw data looks like to the Fluent Bit deployment. This will help identify if the problem is with Fluent Bit or the component after it.
Once the data looks right on the Fluent Bit side, the issue may be resolved. But if not, then we know it’s either a problem with sending the data to the next component or something that component is doing.
Quite often, it’s easy to make assumptions about what you think your data looks like which may be incorrect. A good example of this is parsing kubelet logs. People may accidentally think their data looks like the output of kubectl logs … when actually you need to parse the raw file on disk. Typically, in this case people will want to use the default cri or docker multiline parsers to handle the kubelet format first in the tail input then have a separate parser filter (or processor attached) to parse the logs after reconstructing them from the kubelet format (which is what kubectl logs does first).
Local reproducer
Simplifying the problem also helps you set up a simple local reproducer with no (or minimal) external dependencies. Too often, we get issues raised with “random” failures seen using multiple inputs, filters, and outputs. If you can provide a simple reproducer, others can easily help and use it as a regression test (either by yourself when accepting new versions and/or by the Fluent project) if it turns out to be an issue.
A local reproducer also lets you iterate quickly to test possible changes/tweaks/updates. I like to do this with a simple container-based stack using the dummy output (or even tail if mounting sample data into the container). For example, you can easily have a local fluent-bit.yaml and test it like so:
vi fluent-bit.yaml
…
docker run --rm -it -v $PWD/fluent-bit.yaml:/fluent-bit/etc/fluent-bit.yaml:ro fluent/fluent-bit -c /fluent-bit/etc/fluent-bit.yaml
This will mount the YAML file in and provide it as the configuration file to use (with the -c parameter). You can even just mount the whole local directory if you’re passing in things like parser configuration, test files, etc.
More debugging
Once you’ve simplified and have a reproducible version, then you can start adding more logging and investigating the remaining issues.
Increase your log_level to debug to check for problems and help debug things. This is especially useful when using HTTP APIs where it will show you the request and response. For misconfigured K8S filters, you may see an RBAC failure or incorrect queries showing why you’re not getting any K8S metadata that’s being added.
Always treat warnings as errors, at least when debugging things. A good example is warnings about unknown parsers that are just ignored, while your data is not parsed as expected. Quite often, that’s down to using relative paths with an incorrect working directory before – switch to absolute paths to try that.
Missing Kubernetes metadata is usually down to mismatched tag configuration or invalid RBAC configuration. Using log_level debug will give you the HTTP requests being made and the responses from the K8S API server which usually helps figure out the problem.
The tail input functions like tail -f Linux command by default so will only ingest new log lines added to the file (with a newline) after Fluent Bit is started. You can use read_from_head: true (not recommended) to read data already in the file or the previously mentioned state file via the db: xxx parameter. This will read a new file completely and maintain where it is up to from then on.
Use the –help command to get information about every specific plugin and all its configuration options in the specific version you’re using:
docker run --rm -it fluent/fluent-bit -o opentelemetry --help
Unfortunately, documentation can sometimes be out of date or waiting on a pull request, so please send any updates to https://github.com/fluent/fluent-bit-docs.
Wrapping up
In summary, you can use Fluent Bit with OTEL either directly or interfacing with the OTEL collector. The benefits are that you’ll have a very mature OSS solution and low resource usage of Fluent Bit combined with a lot of options for non-OTEL usage. You may already have Fluent Bit deployed either explicitly or via your cloud provider, so leveraging it rather than deploying and managing another component can also make sense too.
The Kubernetes observability section above aims to explain how Fluent Bit works to extract K8S metadata from the log files and query the API server for more information. If things go wrong, this should provide pointers as to why or what is required.
The final section gives you some tools to help you investigate any issues you may have with incorrect configuration, missing data or the like in your telemetry pipelines following the golden rules of:
- Simplify
- Reproduce
- Debug