
The Operator Pattern, or ‘operators’ as they are colloquially known, present a powerful concept that allows software providers to abstract operational patterns into Kubernetes. Using the operator pattern can drastically cut down the amount of tooling, scripting and manual work required to run complex software.
Operators allow for a single Document (a Kubernetes manifest) to describe the entirety of a deployment, not just the ‘artefacts’ that are being deployed. Although you can quickly deploy a database into a Kubernetes cluster using Helm or a Kubernetes manifest, securing, backing up and managing users, backups etc. is an exercise generally left to the end user.
Compare this to a system deployed with CRDs and Operators where most, if not all, of theseactivities are automated and defined using standard Kubernetes configuration language. This technique makes it easier to reason with the behavior of a given cluster, centralize configuration, and adopt vendor best practices. Although relatively new, the Operator patternhas been adopted by vendors as a way to distribute into Kubernetes, including Elastic.
For fans of Elasticsearch and the growing Elastic Stack, this presents an opportunity to capture the benefits of the default distribution with its growing, full feature set running natively on Kubernetes. Elastic has recently introduced Elastic Cloud on Kubernetes (ECK). Elastic’s vision for ECK is to use it as the official way to run Elastic Cloud on Kubernetes, and they have already baked an impressive amount of functionality into the operator.
STAY TUNED
Learn more about DevOpsCon
5 core benefits of running Elasticsearch natively on Kubernetes with ECK
- Security from the start:ECK configures security, node-to-node TLS, certificates, and a default user for every cluster automatically
- Kubernetes native Elasticsearch resources: Operate Elasticsearch as you would any other Kubernetes resource. No need to configure endless Kubernetes pods, services, and secrets.
- Scale-up with Elastic’s best practices: ECK embeds years of knowledge into everyday Elasticsearch operations – from scaling up to version upgrades.
- Exclusive Elastic features: Get access to all of Elastic’s innovation including Elastic SIEM, Observability, Logs, Infrastructure, and more.
- Advanced Topology: Apply the versatility of your Kubernetes infrastructure to your Elasticsearch deployment. Use advanced topology such as hot-warm-cold architecture to reduce costs.
Until recently, installing a production-ready Elastic Stack has followed relatively standard practice. You create a set of masters to manage the cluster, and then add nodes (potentially with different roles, such as data or ingest, depending on scale), and configure them. Depending on your chosen automation, this could result in a hefty task to manage the Elasticcluster and would need some form of orchestration to check that the cluster is in service and ready for traffic.
Creating a production-ready Elastic environment is not as challenging as some other ‘enterprise’ software, but is complicated enough that it requires a reasonable amount of planning, knowledge, automation, and resources to ensure it is ready to be used in anger.
ECK offers a welcome alternative for deploying Elastic: leveraging the advantages of both Kubernetes and the operator pattern. Although this does not allow you to do away with all aspects of cluster management, it does eliminate many of the mundane issues and softens the sharp edges of some of the other tasks. Elements such as cluster upgrades, securing the cluster, and dynamic cluster scaling are available out of the box with ECK, as well as simplicity of automation.
As a demonstration of an ECK installation, we are going to install a production-ready Elastic stack into an existing Kubernetes cluster. To use the sample code, you will need a Kubernetes cluster to deploy to. This can be either be done locally via Minikube, K3s or similar; or you can deploy it to a cloud-managed cluster such as GCP or EKS. To start, we need to install the Custom Resource Definitions and Operators into the cluster. We do that using the following command:
kubectl apply -f https://download.elastic.co/downloads/eck/1.0.0-beta1/all-in-one.yaml
The command above applies all of the resources that make up the various components ECK.
Now we have the ECK components installed we can create our Elastic configuration. In this example, we’re going to create a robust layout, with multiple masters, separate data nodes, and dedicated ingress servers. We’ll start by creating the master nodes.
Create a new file called elastic.yaml and insert the following code:
Figure 1

Let’s take a look at what this document is doing. The first two lines define which Kubernetes API we are going to use to create the new resources; in this case, it is an API supplied via the Elastic CRD and a resource kind of Elasticsearch. This example exposes the elegance of CRDs as a system to extend Kubernetes, allowing products to add functionality in a discrete namespace.
Next, we define some metadata: the name of the Elastic Stack we are creating, and the namespace we are going to create it in. Adding a namespace helps organise your ECK stack, allowing you to easily separate your monitoring workload from your other workloads, and allows for more granular security within your Kubernetes cluster. If the namespace is omitted, the ECK CRD will create all resources in the default namespace.
Following this, we get into the meat of the configuration: the spec. This is essentially the single place to put configuration items for ECK components. In this example, we are speccing out a nodeSet: . This describes a set of Elastic Nodes, be they Masters, Data or ingest; this is simply an option passed into the nodeset configuration. These nodes are created and added to the Elastic configuration we are creating.
For our configuration, we are setting this particular nodeset as master nodes, and ensuring that we have three of them; this is generally regarded as best practice as it allows [quorum based] decision making to take place within the stack. In general, you should always have an odd number of master nodes.
Now, we pass in configuration items. ECK supports most of the same options as non-ECK installations. Of particular note in this example is the node.store.allow_mmap: option. This configuration item is sometimes necessary on Kubernetes nodes that either have low kernel settings for vm.max_map_count: . However, this setting does have performance implications for high throughput stacks, so it is not recommended for busy clusters. Instead, the following configuration should be added to the manifest within the nodeset tree:
Figure 2
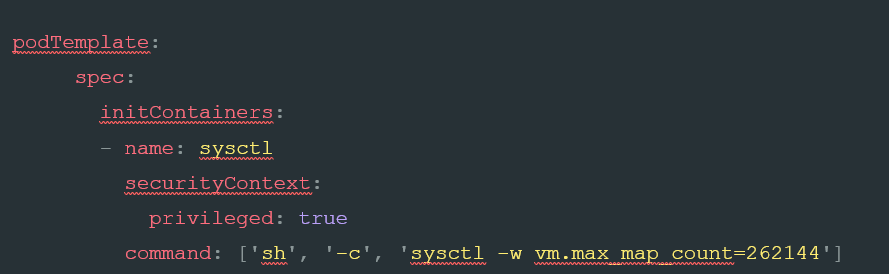
This setting will pass the kernel options to the underlying node; however, it is predicated on being able to run privileged containers. As privilege is by no means certain, especially on highly secure Kubernetes clusters, it is well worth checking if it is available while planning your Elastic ECK rollout.
Going back to our initial code (Figure 1), the focus turns to setting resource allocations at various levels within the stack. Omitting these settings will cause the CRD to use the default settings, which can significantly impact the overall cluster performance.
The first two items in this part, resources: and env: , both set limits on the volume of different resources that the nodeset is permitted to consume. In our example, each of our three master nodes are allowed to utilise 4GB of RAM and two CPU cores from the Kubernetes cluster. Without this configuration, the Elastic instances are able to consume a far greater volume of resources than you might want, which can constrain the ability to schedule workloads within the cluster.
env , then sets an environment variable to pass limits into the JVM. Don’t skip this. Without this setting the JVM options are defaulted to 1gb of RAM, so regardless of how much you allow it in the Kubernetes cluster it would not be able to utilise it effectively.
Finally, we set a volumeclaimTemplate: . This template is also crucial as it defines how and where data is stored for Elastic. By default, ECK sets a default of a one gigabyte storage claim within the cluster. This default ensures that the data is kept separate from the nodes so that data is not ephemeral and lost during a node reschedule or deletion. It does not, however, ensure there is sufficient space or performance on that volume claim for a production workload.
Instead, as in this example, we set an explicit volumeclaimTemplate: and make use of a storageClassName: setting to ensure the correct type of drive is in use. The type and size of the drive will vary based on your Kubernetes provider, but most now provide at least standard (which tends to be either platter-based storage or slow SSD) and some form of faster storage (such as fast SSD or indeed more exotic speedy storage). Again, tuning storage for the workload is one of the key tenants of Elastic deployments and ECK makes it straightforward to provide the correct storage to the correct node.
Now that we have defined our master, we can go ahead and define some ingest nodes by adding the following configuration into our elastic.yaml file:
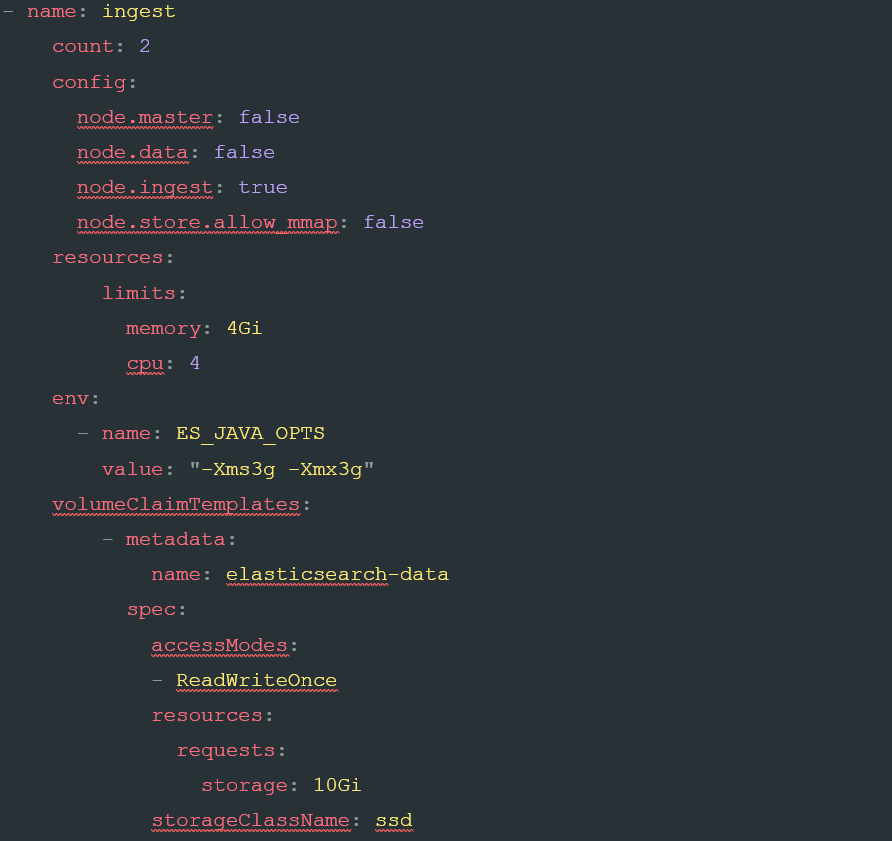
As you can see, this looks very similar to the previous example, precisely because the same CRD is constructing them. In this case, we are changing three things to make this nodeset ready for ingest; the count: , limits for cpu: limits and storageclassName: . This difference in settings is to take into account the unique role that ingest nodes play, needing enough CPU to parse incoming requests, fast disk to buffer them, and no need for a quorum.
To go ahead and create our data nodes using the same template, we insert the following code into the elastic.yaml file:
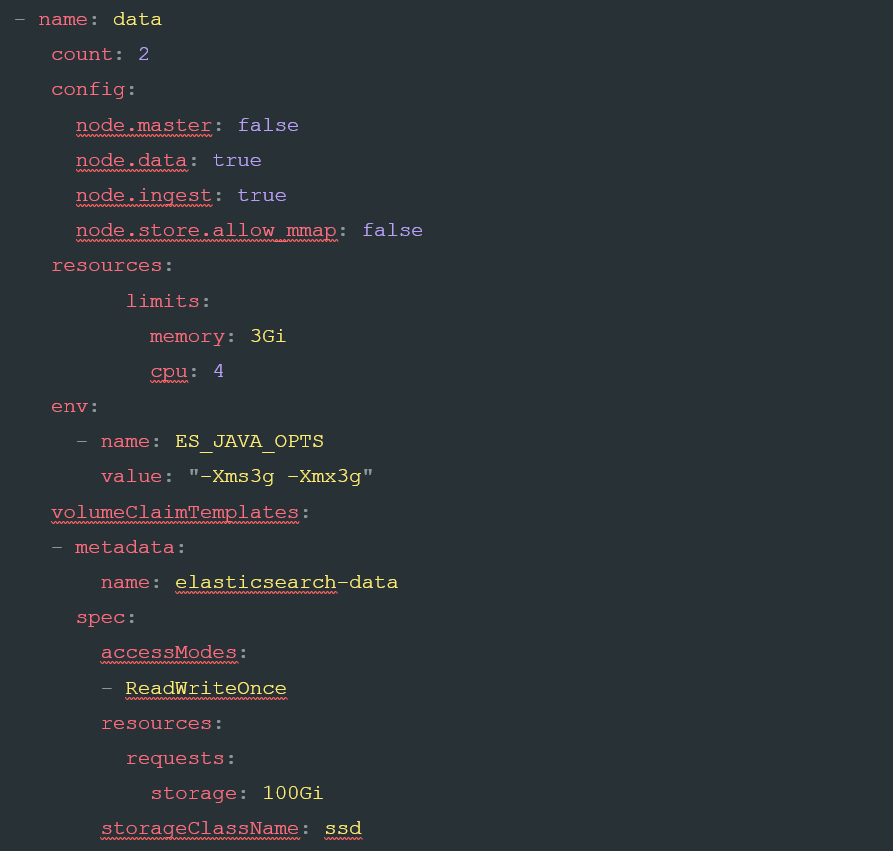
Again, we’ve made some minor changes, amending the count to four nodes, increasing the CPU to four cores, and setting a large amount of high-speed disk.
We now have everything we need to deploy Elastic to our Kubernetes cluster. First, however, it is worth touching on the concept of pod affinity. This is a concept that allows Kubernetes to schedule pods so that they are either scheduled onto the same node or, in the case of anti-affinity, kept apart wherever practicable. This feature is especially relevant in the case of Elastic where you may wish to keep specific nodes apart, both for performance and for reliability purposes.
Scheduling is especially relevant for the masters where the loss of a Kubernetes node with multiple masters may threaten the Elastic Stack’s ability to function. By default, ECK sets a default policy of pod anti-affinity for all resources it creates, ensuring that Kubernetes will attempt to keep them apart. This default is fine in most cases but can be overridden, if required, using the usual Kubernetes configuration found here:
https://kubernetes.io/docs/concepts/configuration/assign-pod-node/#affinity-and-anti-affinity.
It is worth noting that to keep Elastic components separated correctly, you need enough underlying Kubernetes nodes to support this. For instance, with three masters, two data nodes and two ingest nodes, I need at least seven nodes to keep them separate, and these nodes need to be able to schedule the Elastic pods. When running the stack it is worth monitoring the extent to which co-location of pods is occurring, and if it is occurring, mitigating it either by setting explicit anti-affinity policies, or by increasing the Kubernetes node count.
ECK also sets a default Pod Disruption Budget (PDB) for the Elastic Stack. By default, this is set to 1, meaning that there can only ever be one pod out of service at any given time. This default ensures that when Kubernetes is rescheduling Elastic pods, it endeavors to limit this to one pod at a time. This limit is relevant when upgrading the stack as it ensures that a ‘rolling’ update is enforced. On larger stacks where more pods can be safely out of service at any given time, you can explicitly set this higher.
Now we’ve covered off some of the elements that ECK adds to ensure stability lets go ahead and deploy our Elastic Cluster. You can do that by using a simple kubectl command:
kubectl apply -f elastic.yaml
This command applies the configuration to your cluster. Within a matter of minutes, you should have a new cluster up and running. You can check by using the following command:
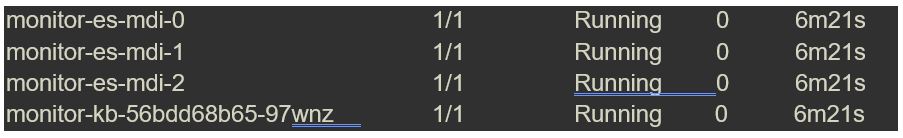
kubectl get pods -n elastic-cluster
You should see the following returned:

Finally, we need to add Kibana to our installation. Kibana is defined using a separate CRD to the Elastic cluster. Add the following code to your elastic.yaml file (Or indeed a separate yaml file if you prefer to keep them separate):
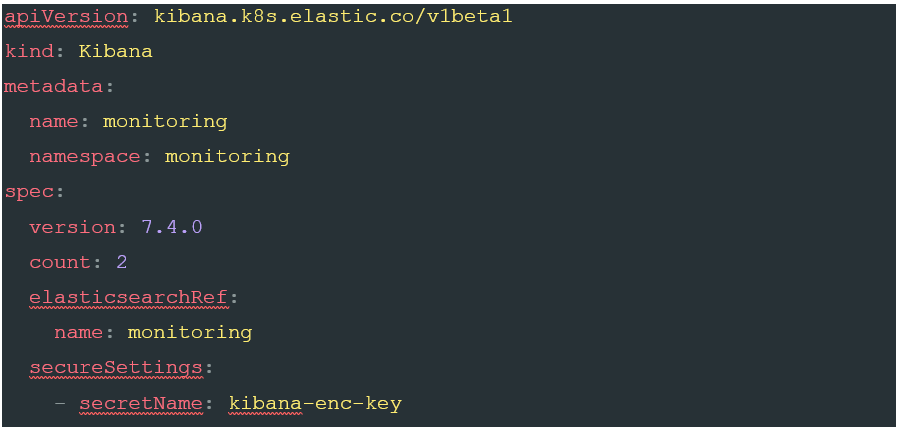
This should look fairly familiar by now. As with the Elastic components, we start by declaring at the start of the document that we are using the ECK CRD’s, and asking for a resource type of ‘Kibana’. As with the Elastic stack, we then give it both a name, and a namespace. The spec version is once again very similar. Here, we declare the version of Kibana we would like to install, plus the number of nodes we want. Since we are aiming for a production deployment, two is the minimum number we would want as it allows for continued service if one pod is out of service (Depending on the scope and SLA’s you work under you may want even more than two). Introducing multiple nodes does add an additional manual step as each node in the cluster must use the same encryption key. To add the encryption key, add a new secret to your kube cluster with the following terminal command:
 kubectl create secret generic kibana-enc-key --from-
literal=xpack.security.encryptionKey=94d2263b1ead716ae228277049f19975aff864
4b4fcfe429c95143c1e90938md
The xpack.security.encryptionKey can be anything you like as long as it is at least 32 characters long. You can find more details on this setting here: Security Settings in Kibana
Now we have set out an encryption key, we can finish the rest of this part of the configuration. The next element, elasticsearchRef: is the name of the ElasticSearch cluster we want this Kibana instance to connect to. This should be set to match the name: setting in the metadata of the Elastic Cluster document, in this case, monitoring. Finally, we tell the Kibana instances where to find the encryption key we set up with the previous terminal command using the secureSettings key.
This defines the basic layout of our Kibana cluster. However, much like the Elastic Stack, we should set constraints around resource usage. We also may want to make the Kibana service available via a LoadBalancer, either internally or externally. To achieve this, add the following code snippet to your kibana.yaml file:
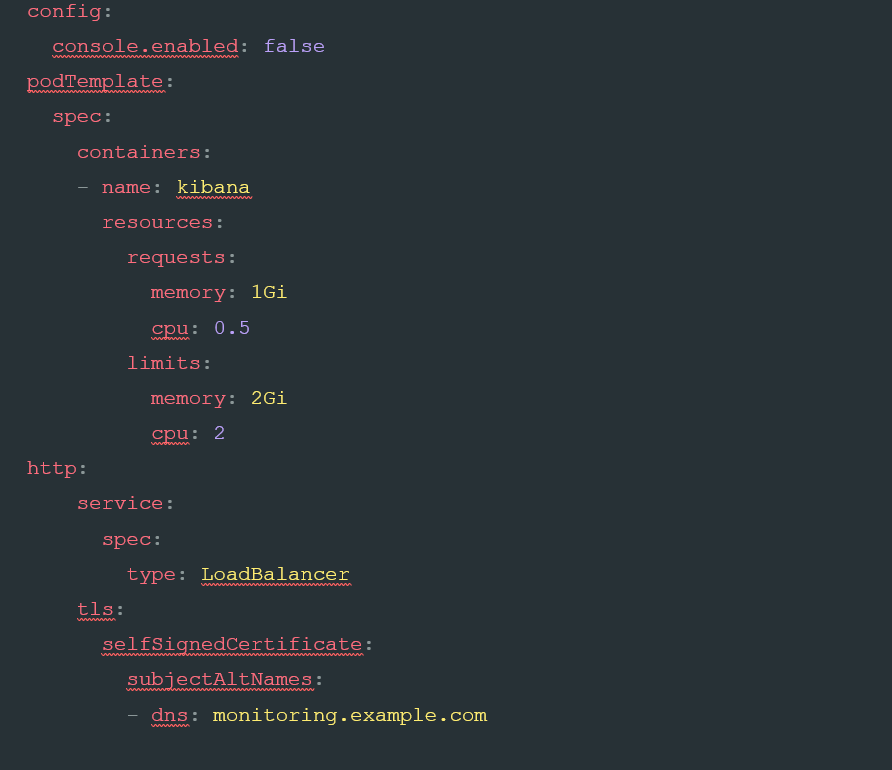
This code adds the finishing touches onto our Kibana cluster. To start, we add a config item to be passed into Kibana. This particular setting, console.enabled: , turns off the developer console in Kibana, and can be desirable within more secure settings. The next part of the document, the podTemplate is essentially the same as what we set in the Elastic cluster, and defines the minimum resources required by Kibana.
The http: setting is where we are able to surface our Kibana cluster to users without the need to use a Kube Proxy, or other more manual methods, to get inside the Kubernetes cluster network. This allows us to define two important elements: the way the Kubernetes service is defined, and additional DNS names within the generated certificate. By default, the ECK CRD creates services as NodePorts. This ensures that access can only come from within the cluster, and generally means you need to proxy into the node to see Kibana. By overriding this default to a
LoadBalancer type, the service will be made accessible from outside the cluster. The final setting, tls: , allows you to add additional DNS names to the certificates created by the service. This should prevent any certificate errors when you connect externally.
Once you’re happy with your settings, save them and apply using the kubectl -f kibana.yaml command. This will apply the settings to your Kubernetes cluster. Within a few minutes you should be able to connect, either using a Kubeproxy to the nodeport if you have elected not to use a load balancer, or to the load balancer address if you have, and you should see the Kibana log in screen. To log in, use the username of elastic, and retrieve the automatically set password by issuing the following terminal command:
kubectl get secret -n monitoring monitoring-es-elastic-user
-o=jsonpath='{.data.admin-password}' | base64 --decode; echo
Note the -n switch on that command to ensure I’m looking at the namespace I created at the cluster creation time. This should return you a password to login into Kibana.
Hopefully you now have a running, production-ready Elastic cluster, and a Kibana console to query it with. This article has explored some of the convenience and power of the ECK product, and demonstrated where it can be configured to make it resilient and ready for production users. In the next article we are going to explore how we can get data into our new cluster using Metricbeat and Filebeat.